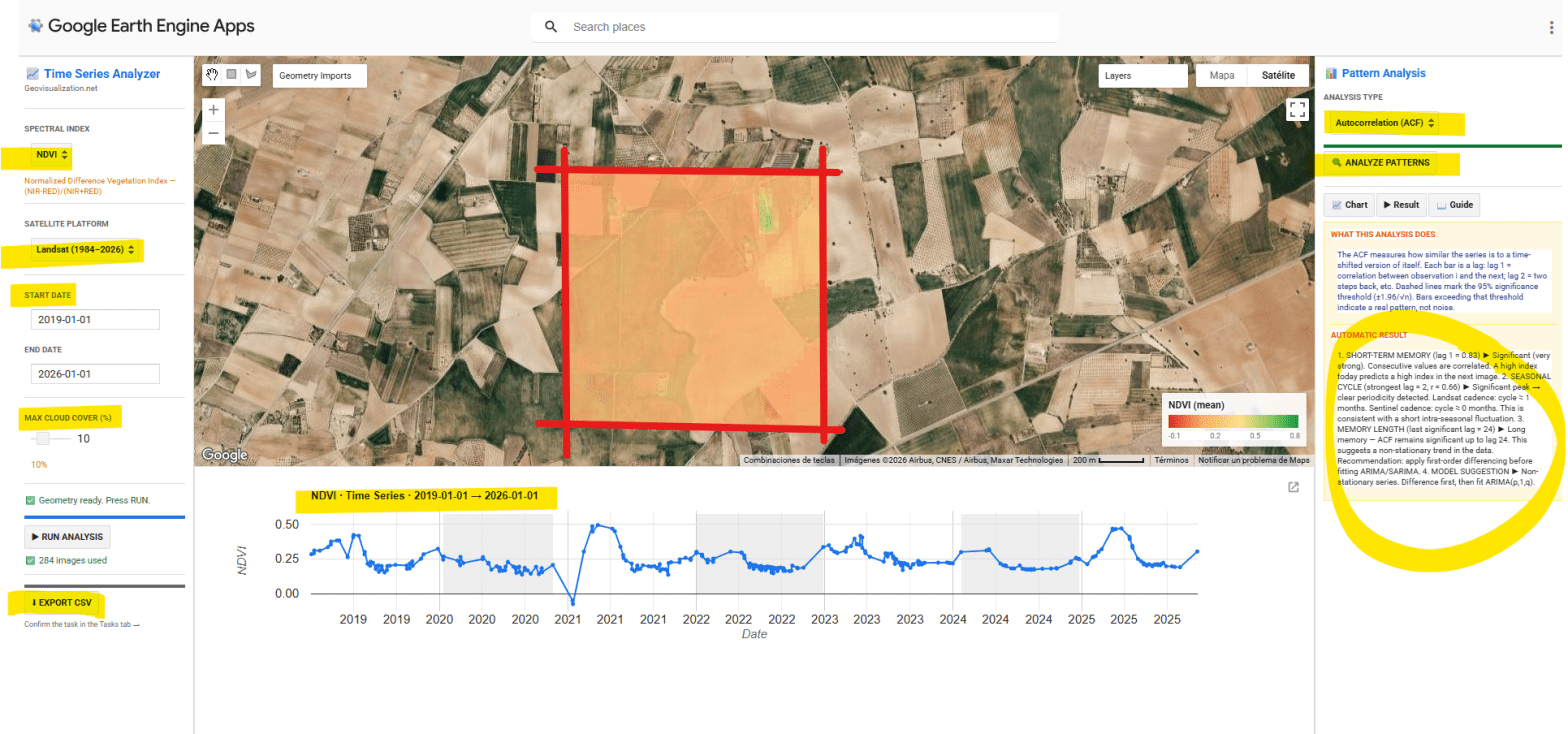
He desarrollado una aplicación interactiva en Google Earth Engine para la extracción y análisis estadístico automático de series temporales de cinco índices espectrales (NDVI, EVI, SAVI, NDWI y NBR) sobre cualquier geometría definida por el usuario en cualquier sitio del mundo. El objetivo es pasar de una imagen satélite puntual a una comprensión temporal del territorio: qué ha pasado, qué patrón subyace, y qué cabe esperar.
Category Archives: real state
POI Intelligence for Urban Asset Analysis in RStudio: assetIQ
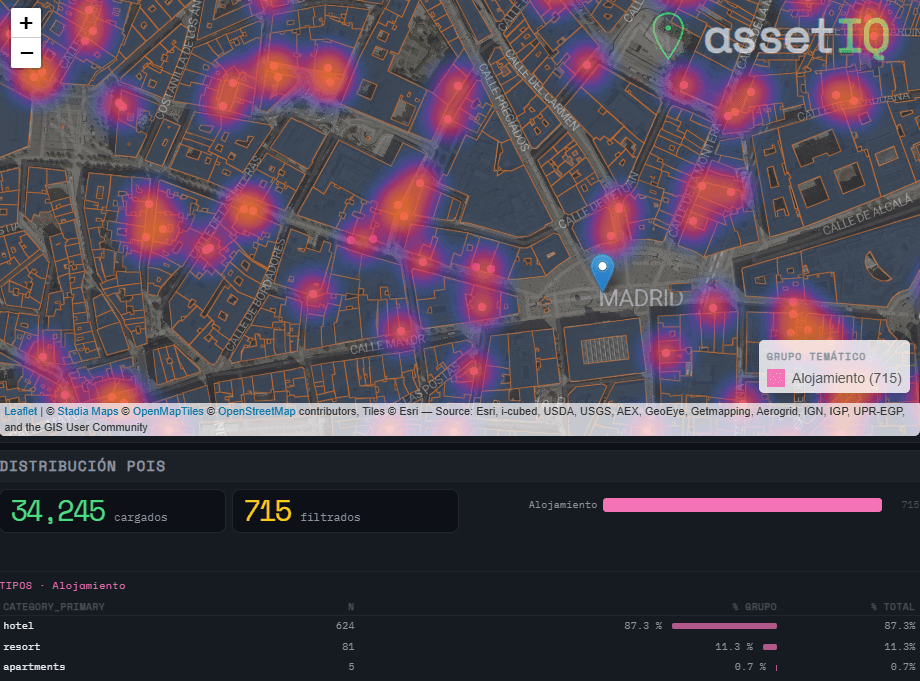
When analysing urban assets, there is genuine value in moving beyond generic neighborhood scores. The density of a coffee shop cluster, the proximity to a financial hub, or the concentration of accommodation around a transport node are signals that traditional datasets flatten into averages — or ignore entirely. assetIQ was built to change that. assetIQ is an R application powered by DuckDB and Overture Maps that extracts, classifies, and scores Points of Interest (POIs) for any location on Earth. You define a city and a search radius — from 100 meters to 25 kilometers — and the tool queries the Overture Maps Places dataset in real time, classifying each POI into thematic groups: Food & Drink, Retail, Health, Education, Transport, Accommodation, Financial Services, Leisure & Culture, Sport, and more.
The core output is an attribute value called POIQ: a normalized 0–1 score assigned to every building footprint within the area of interest, derived from a Kernel Density Estimation of the selected thematic group. A building in a dense retail corridor scores close to 1. An isolated residential block far from any commerce scores close to 0. This transforms thousands of individual points — which in raw form tell you very little — into a single, interpretable attribute per building, ready for downstream modelling, valuation, or site selection.
Urban development in Madrid from the mid-19th century to the present day

All existing buildings in Madrid currently listed in the Land Registry database have their year of construction recorded. This map shows, by decade, where the bulk of that urban development took place. For example, in the 1920s it was in the Salamanca district, in the 1930s in Chamartín… shifting from development in the city centre to the outskirts.
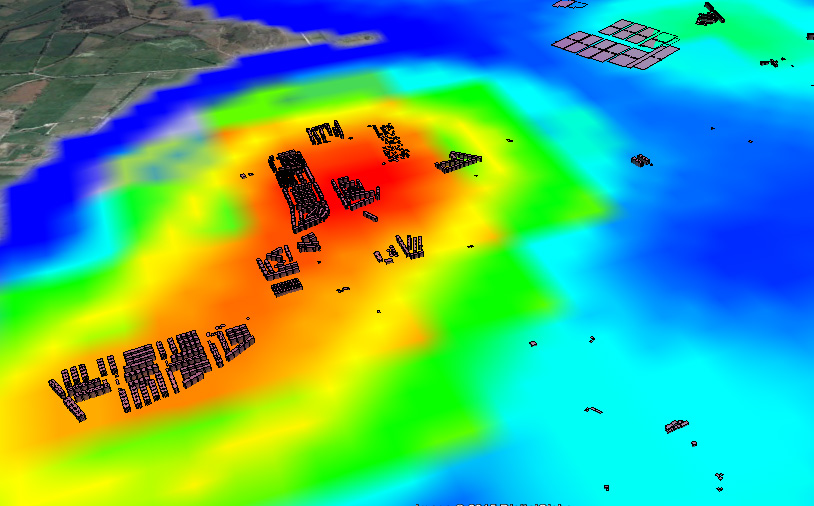
The Remarkable Visibility of Almeria’s Greenhouses from Space

In the sphere of Earth observation and remote sensing, the Almeria greenhouses stand out as an astonishing spectacle visible even from the edge of space, defined by the Kármán line at approximately 100 kilometers in altitude. This unique visibility is not only a testament to the vast scale of human agricultural activity but also a captivating example of the power of satellite-based remote sensing technologies.
Consultoría e ideología: Manual de estupidez

Yo soy un humilde Geógrafo, además soy alguien curioso al que no le importa meterme en mil fregados por las razones más variadas, que ha trabajado y trabaja como tal pero también como diseñador, como fotógrafo o como comercial. He trabajado con obreros, con arquitectos, porteros de fincas, con dibujantes, con consultores de todos losContinue reading “Consultoría e ideología: Manual de estupidez”
NO AL PELOTAZO DE LA ERMITA DEL SANTO

Esta semana pasada he estado colaborando puntualmente con la Plataforma “planermitadelsanto”, vecinos como yo que se han (nos hemos) organizado para echar abajo un plan de recalificación urbanística que no es ni mucho menos del interés general. He preparado para ellos algunos mapas en 3D (georeferenciando planos, extruyendo manualmente usando datos del Plan propuesto, realizandoContinue reading “NO AL PELOTAZO DE LA ERMITA DEL SANTO“
Retirada de vehículos por la grúa municipal en Madrid: Una aproximación visual usando Datos Abiertos.

Solo estoy tomando en cuenta 185 puntos debido a las limitaciones de mi servidor de geocode https://www.mapdevelopers.com/batch_geocode_tool.php pero muestra que los datos tienen sentido, siendo el barrio de Sol el que concentra una densidad mayor de actuaciones de la grua municipal. Para el fondo, he usado una conexón WMS a OSM y geometrías de Barrios tomadasContinue reading “Retirada de vehículos por la grúa municipal en Madrid: Una aproximación visual usando Datos Abiertos.”
Change detection – Detección de cambios en polígonos
THE PROCEDURE: Centroids of buildings; Spatial join showing presence-absence, considering a 10m accuracy threshold, meaning if the centroid has not moved more than 10m, its the same building. If the centroid in 2012 is not in 2014, its considered as demolished. If a new centroid appears its considered new building.
Solar + Shadows analysis on Rue Massillon, Nantes (France)
This is the beautiful building in from of my house in Nantes… Let’s model it first using Sketchup. Also I have used a non standard style only for visualization purposes… If we have the North behind us this means we are going to have a lot of light… but so far we are just guessing… Now weContinue reading “Solar + Shadows analysis on Rue Massillon, Nantes (France)”
Shadow analysis en Puerta de Arganda, Madrid.
Hoy publico en español puesto que los datos son en español y yo soy español:-) but if you guys have any doubt dont hesitate to ask… even if you are french I will be around to answer you back “en français”, quand même !!!. La idea era hacer un estudio de sombras de para mi propio usoContinue reading “Shadow analysis en Puerta de Arganda, Madrid.”
