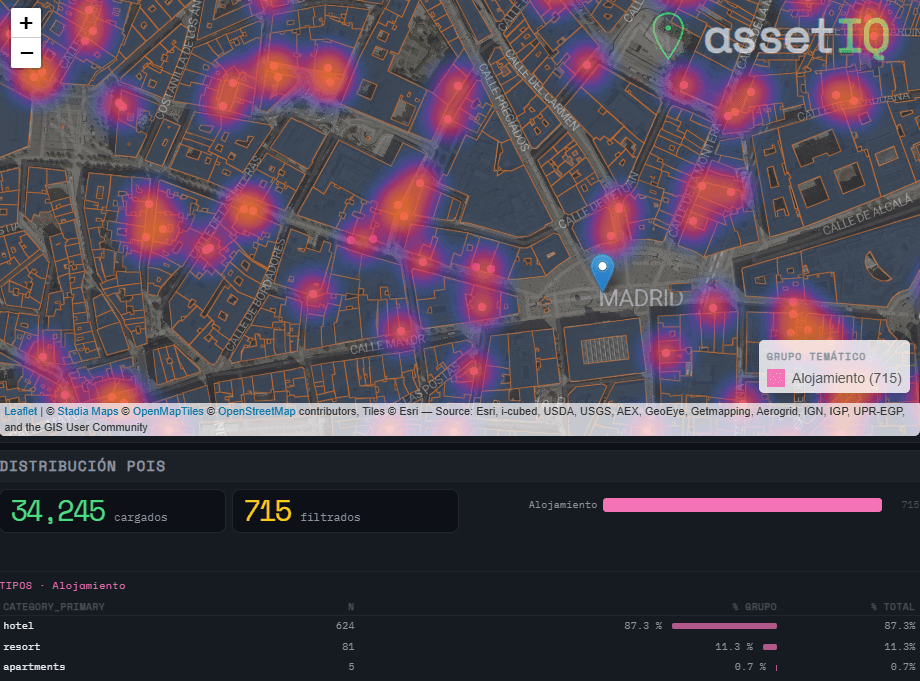
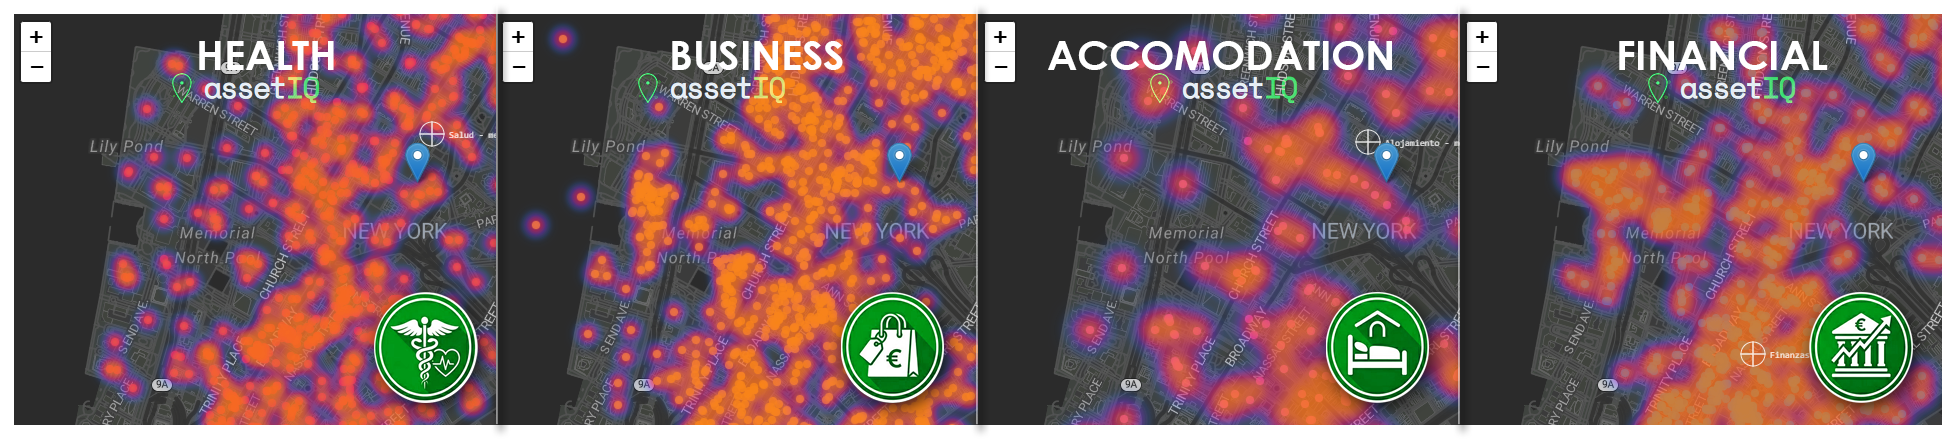
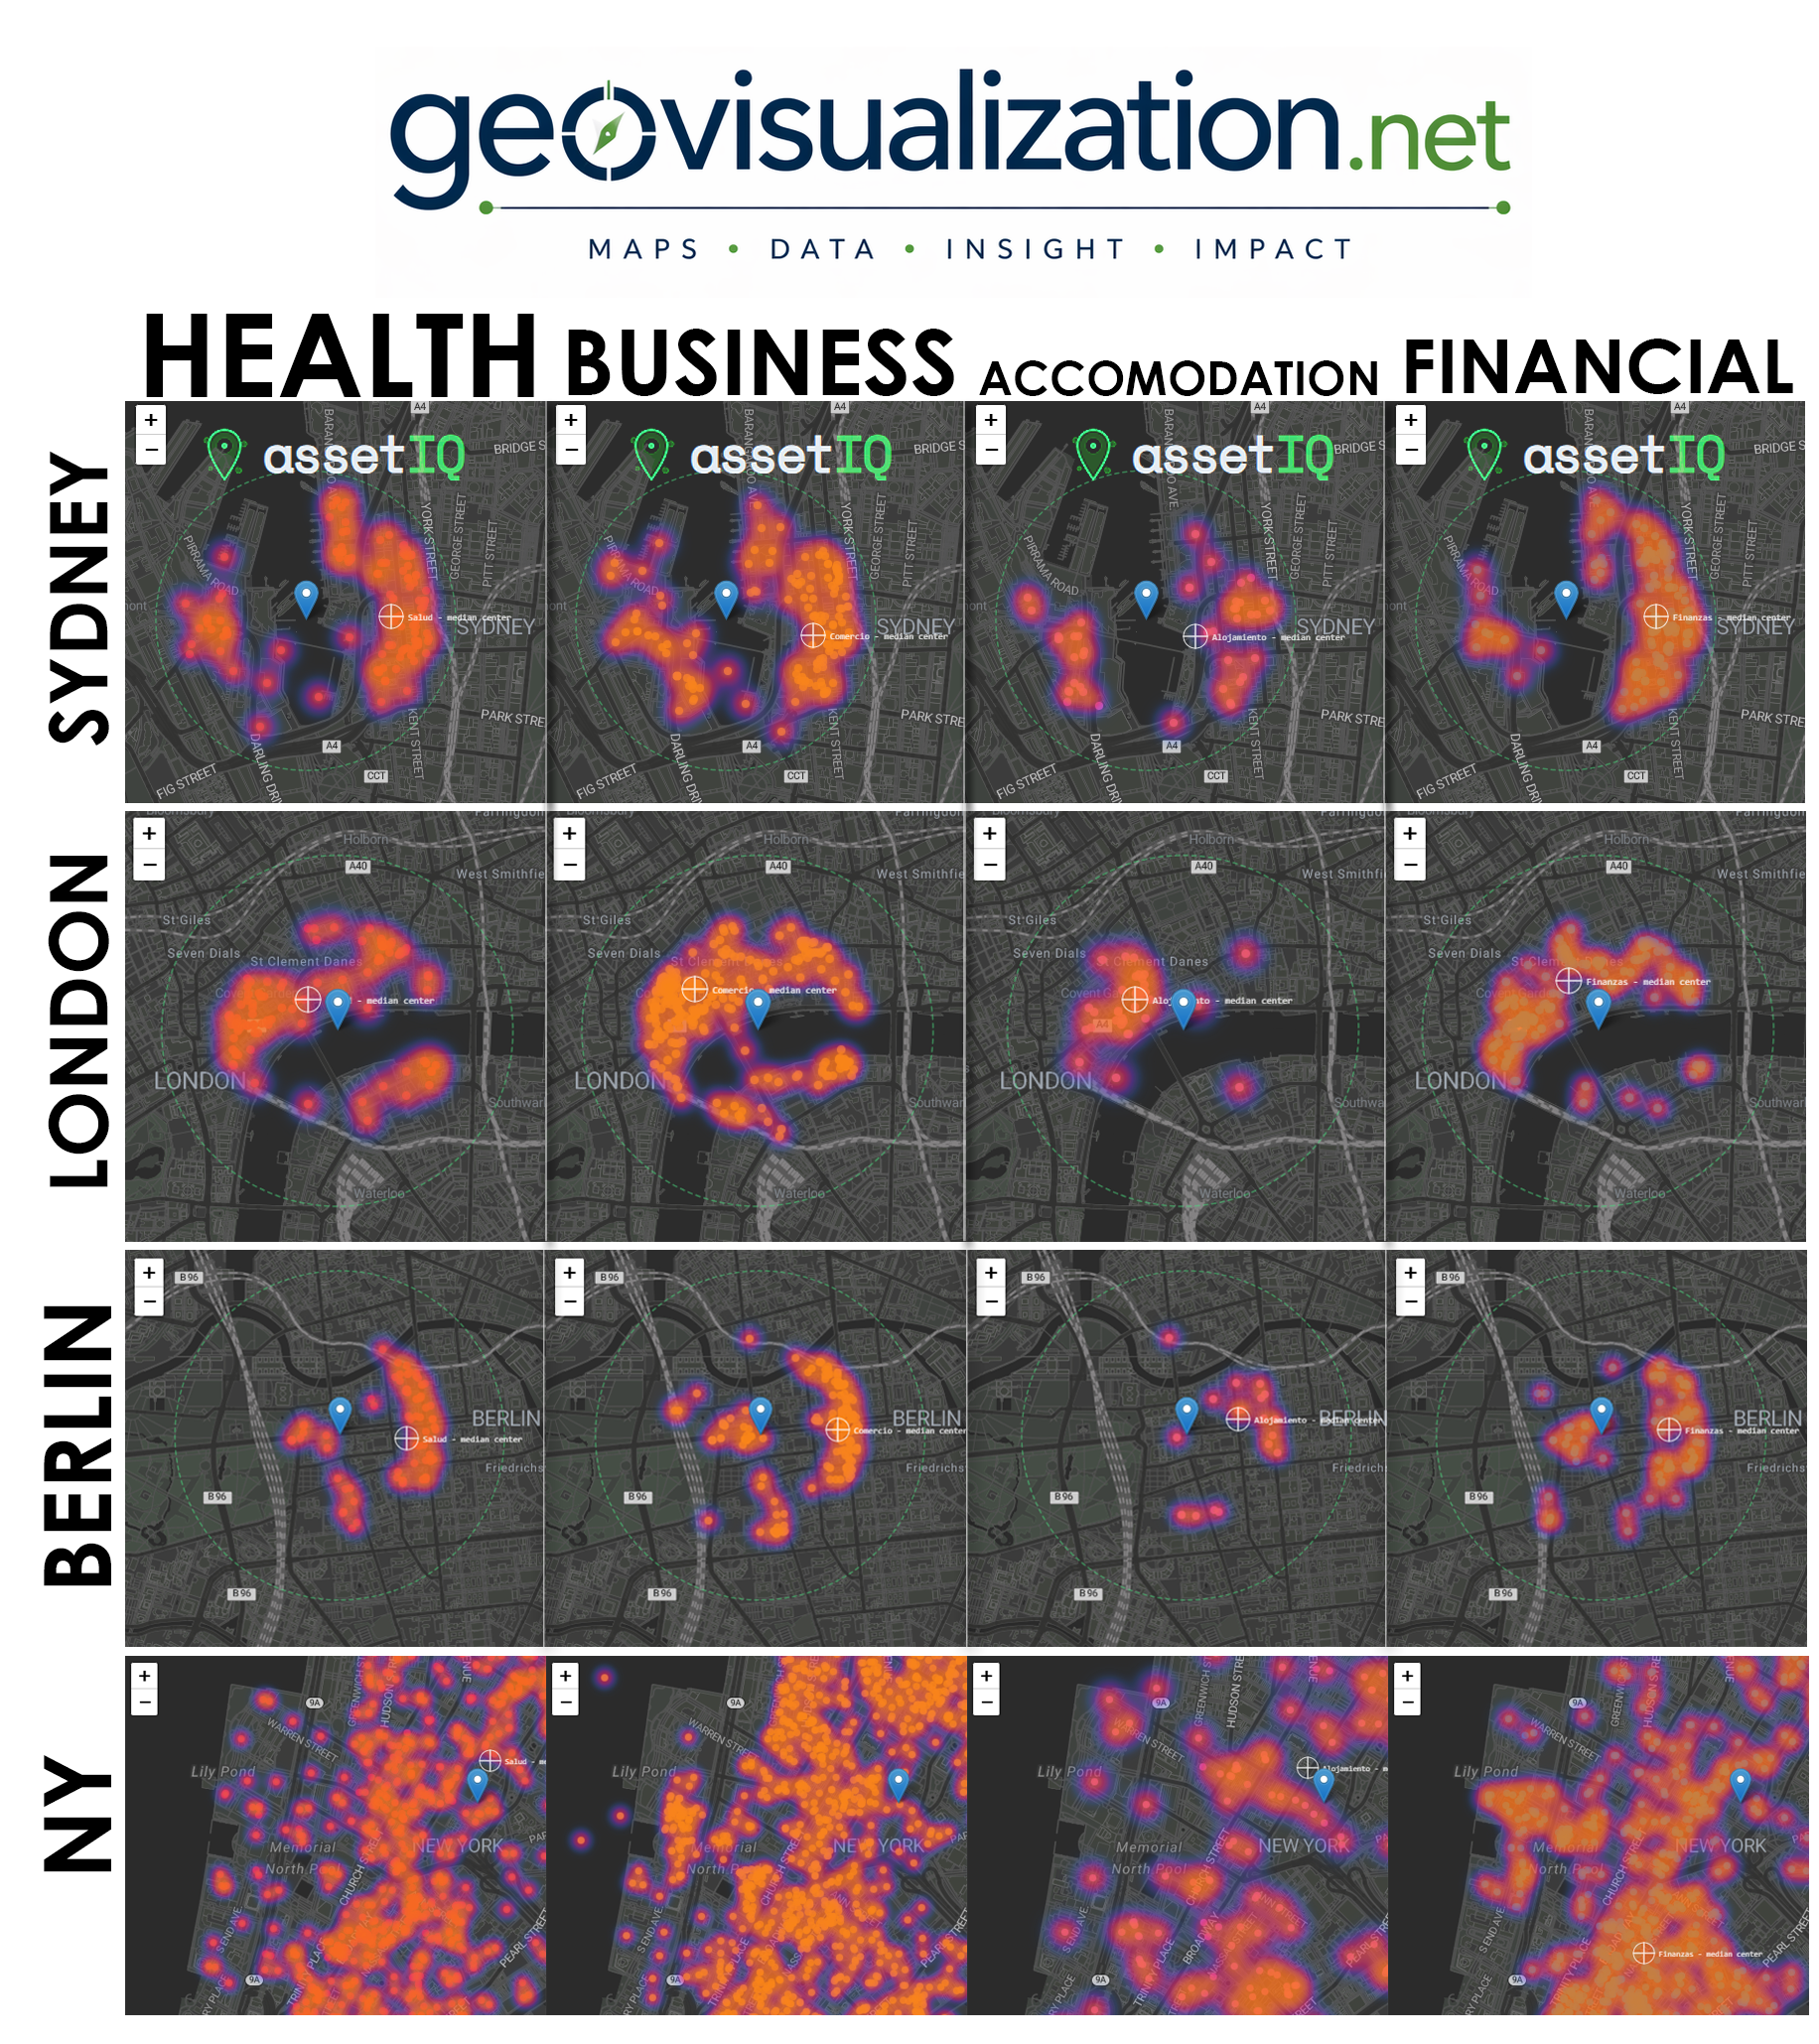
When analysing urban ASSETS, there’s true VALUE in disaggregating Points of Interest (POIs) into hyper-local layers, separating retail density, financial hubs, and hospitality ecosystems into distinct, relative indicators. This is as sharp as it sounds, my app, assetIQ was built to add value to your POIS.
https://albertogis.shinyapps.io/TOIconPOI
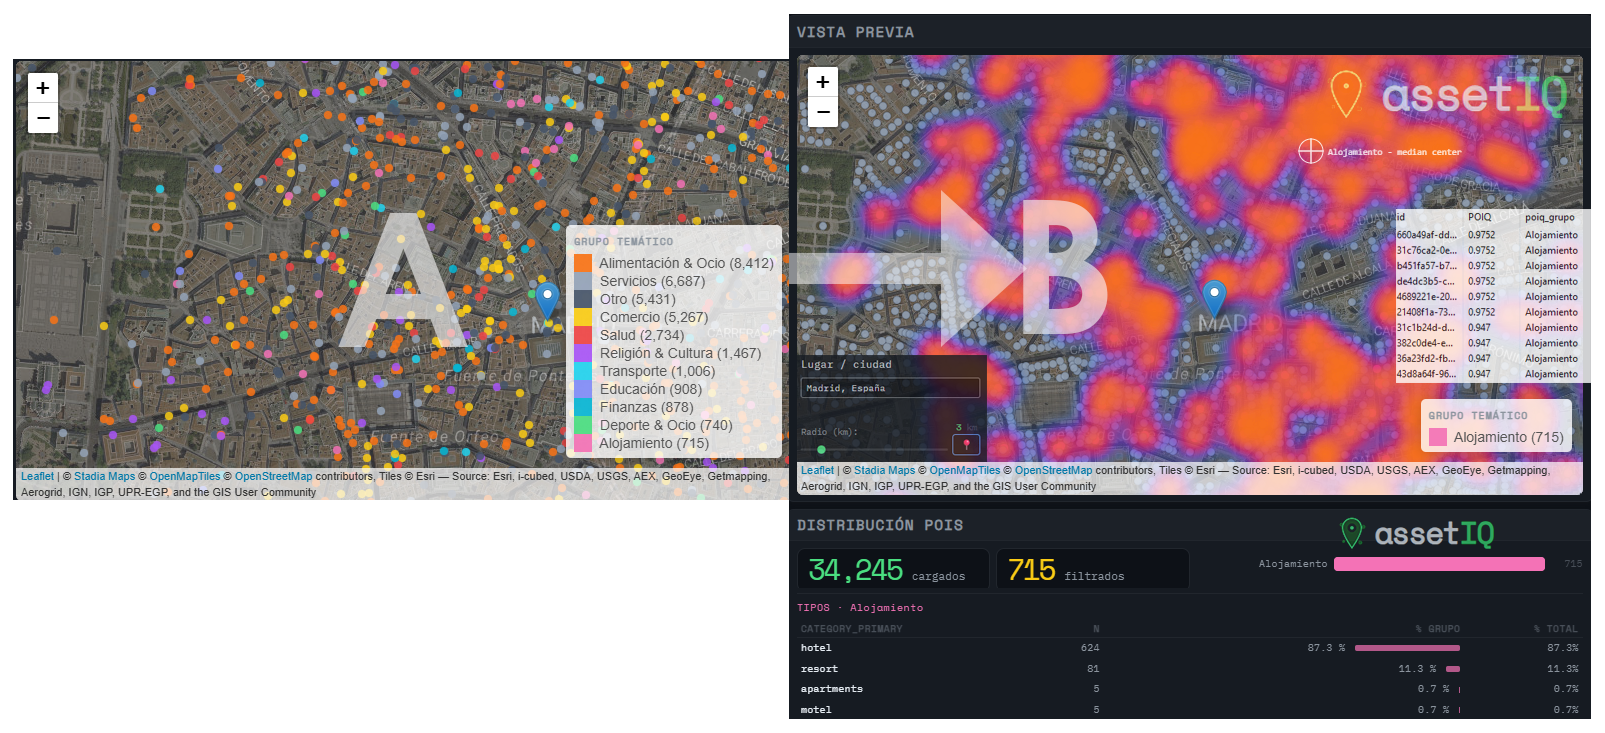
What is assetIQ?
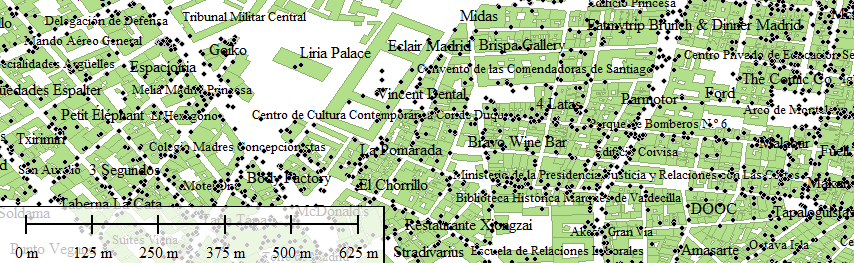
assetIQ is an R application powered by DuckDB and Overture Maps that extracts, classifies, and scores Points of Interest (POIs) for any location on Earth. You define a city and a search radius — from 100 meters to 25 kilometers — and the tool queries the Overture Maps Places dataset in real time, classifying each POI into thematic groups: Food & Drink, Retail, Health, Education, Transport, Accommodation, Financial Services, Leisure & Culture, Sport, and more.
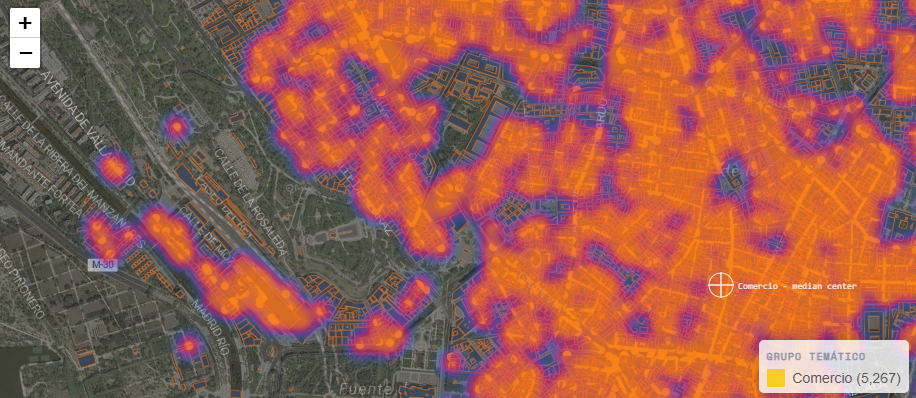
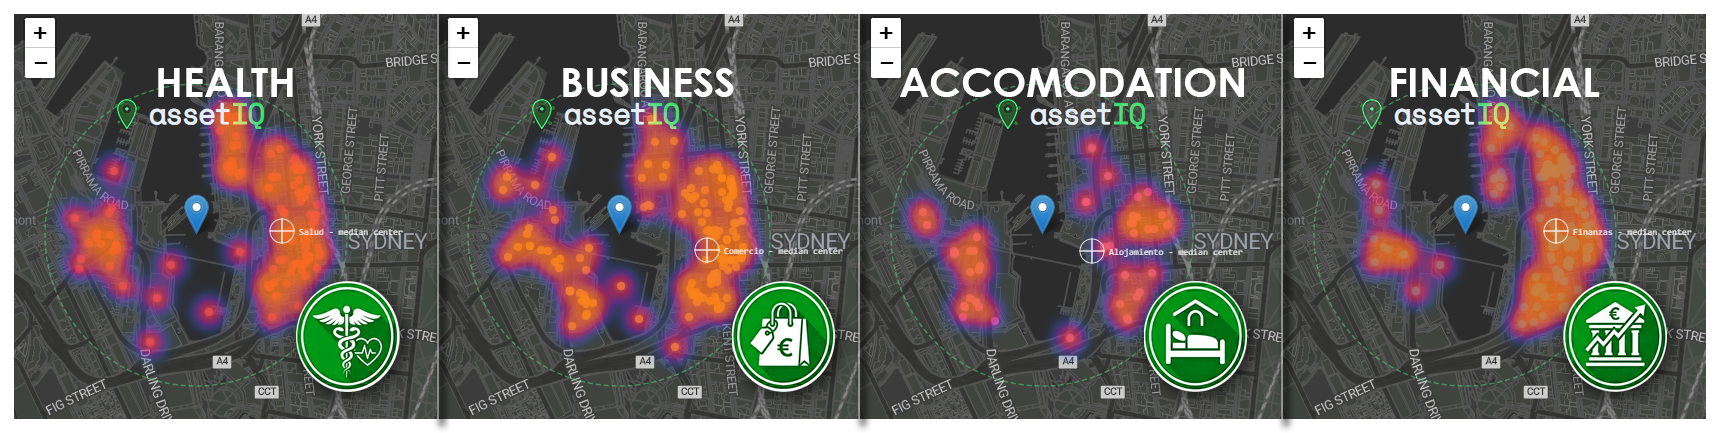
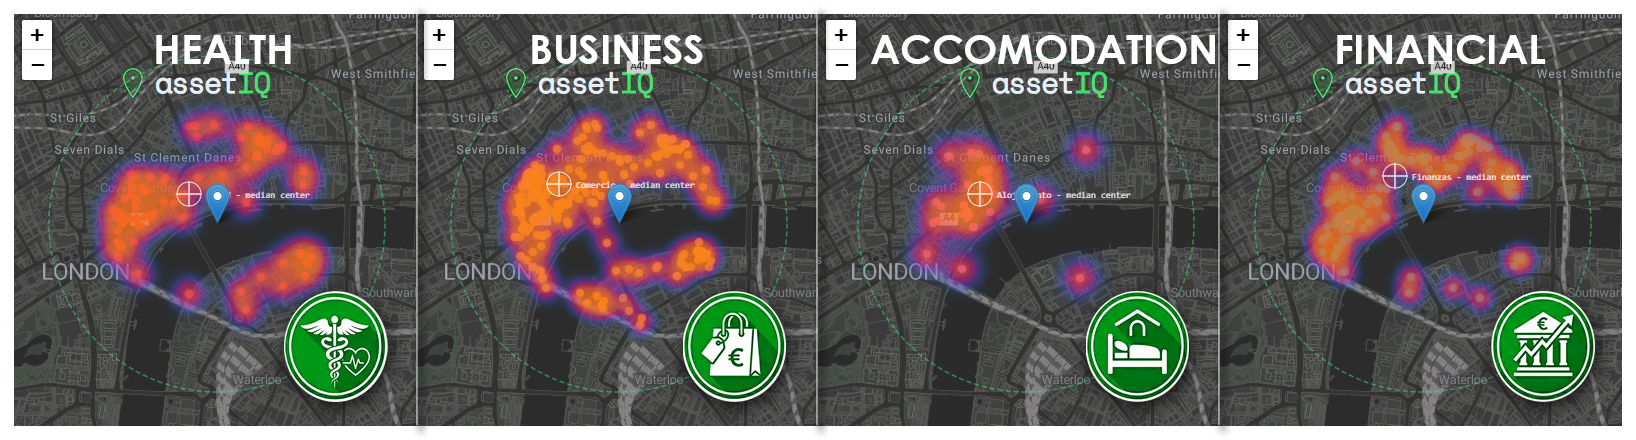
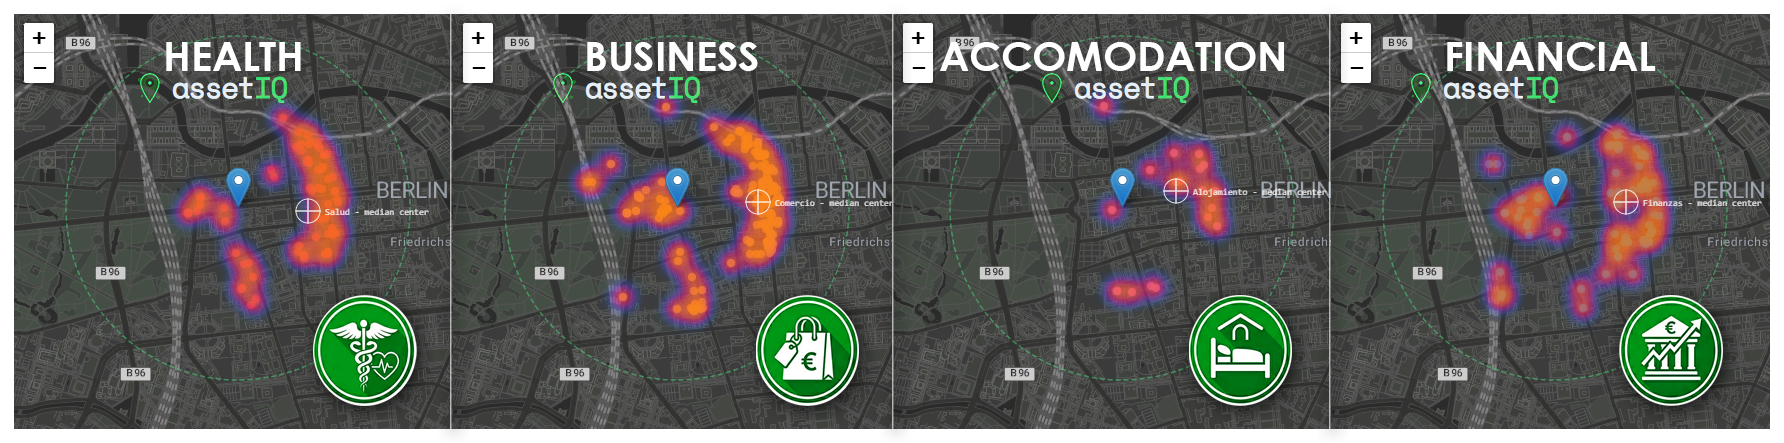
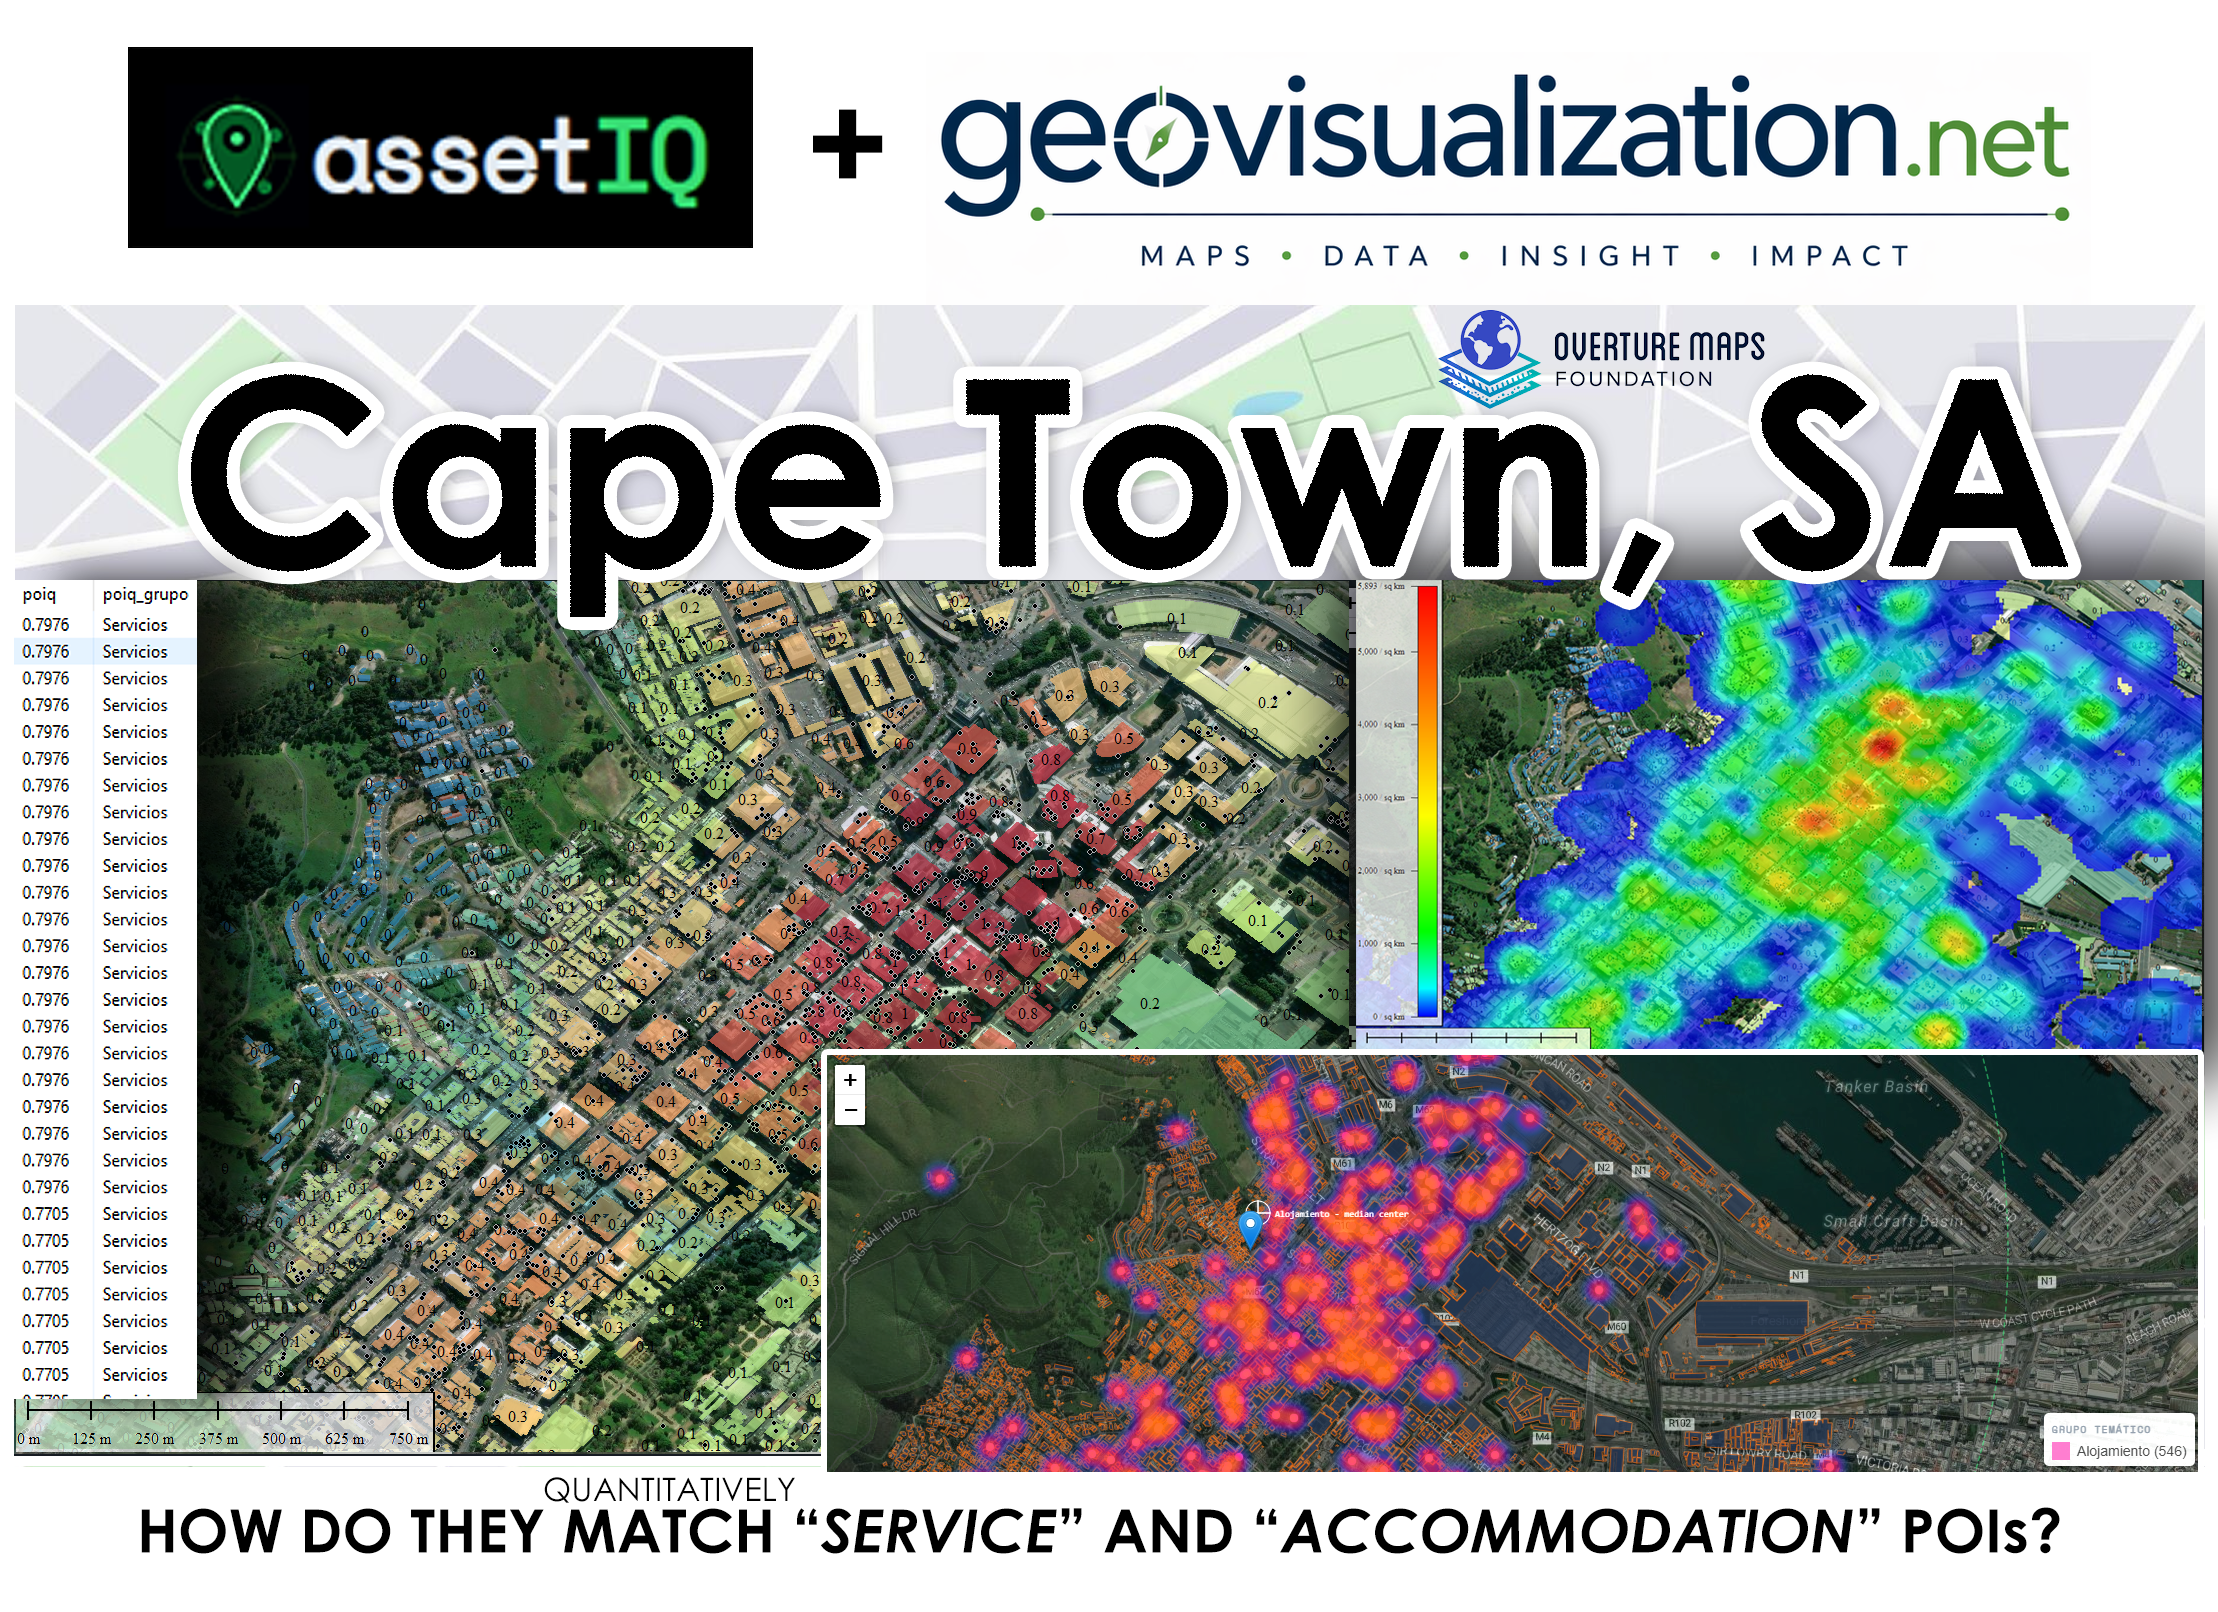
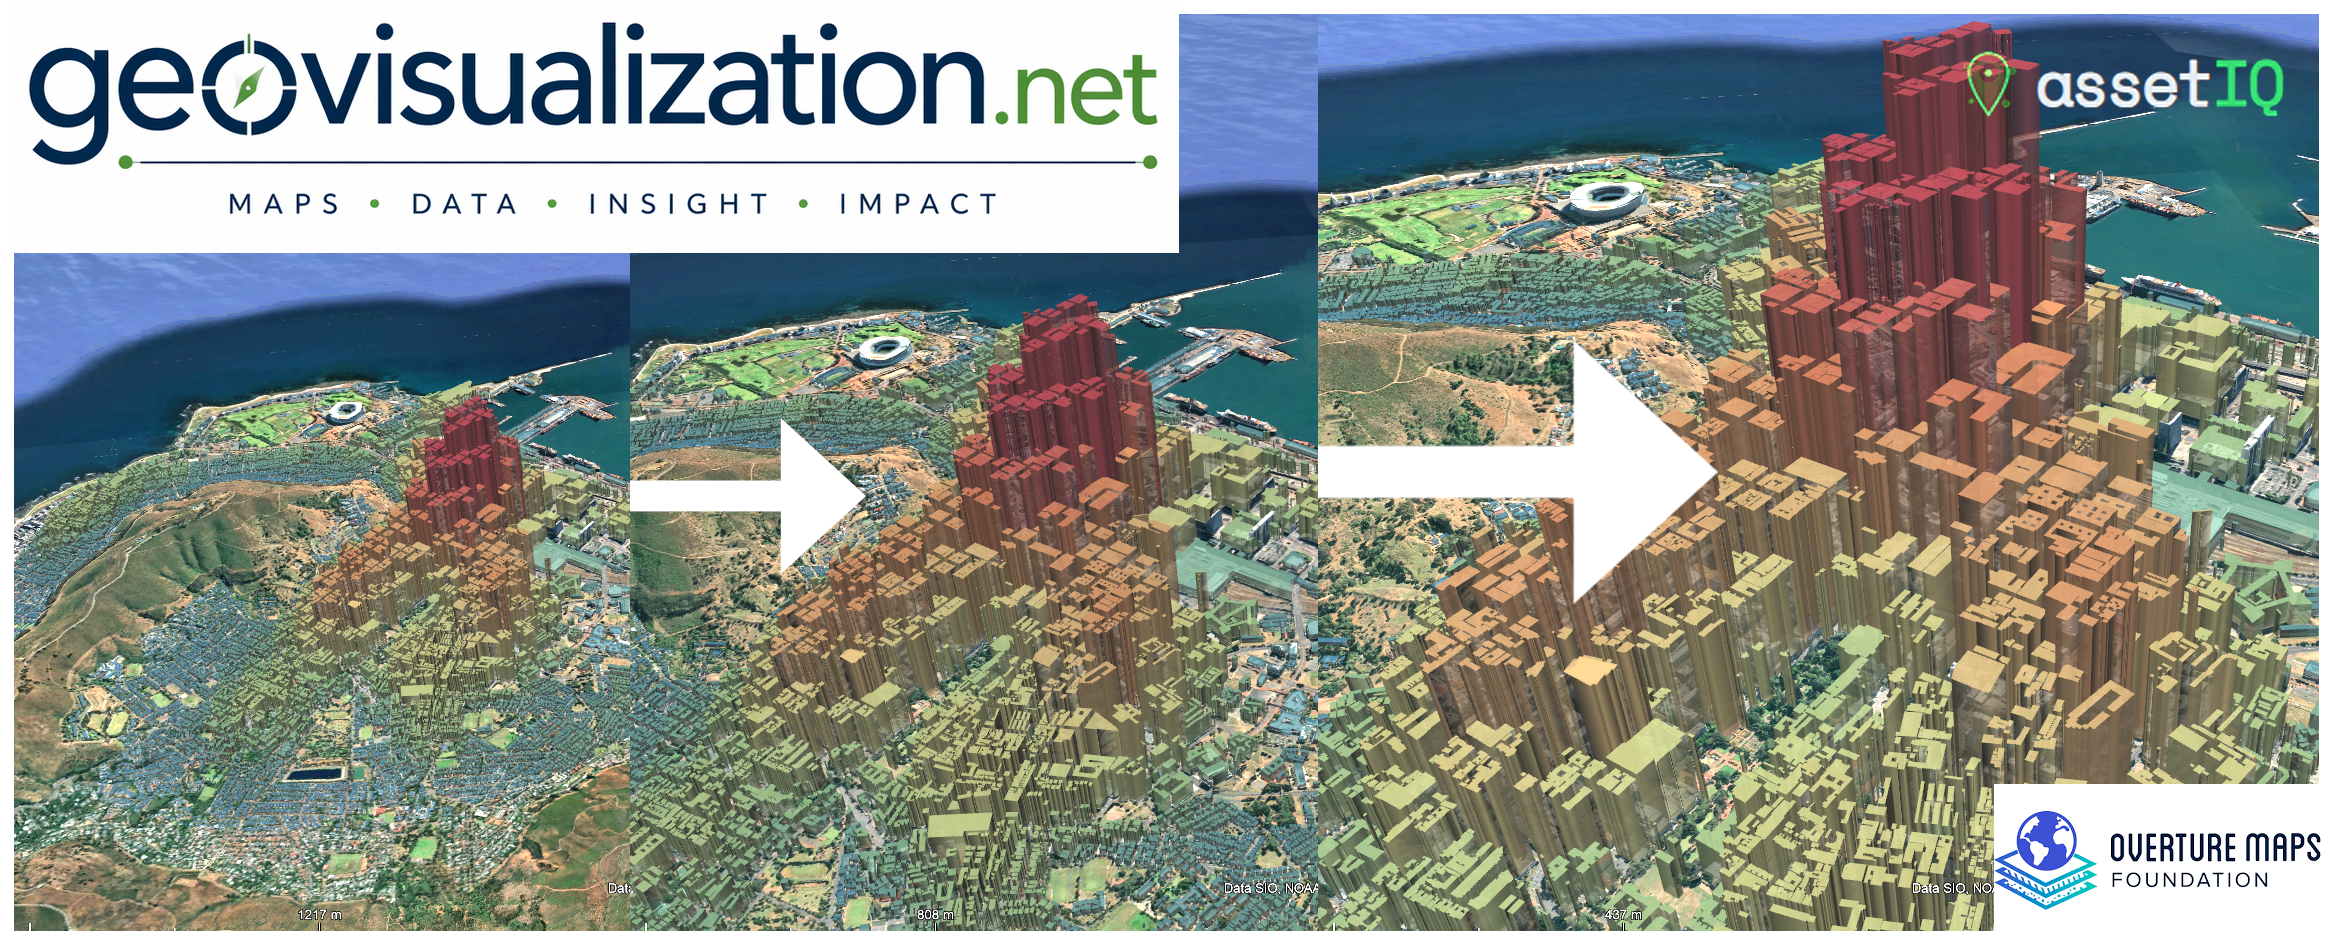
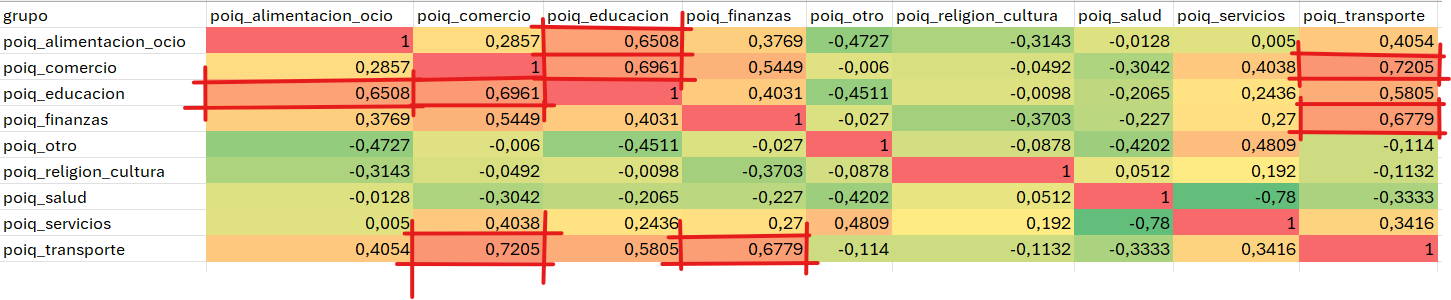
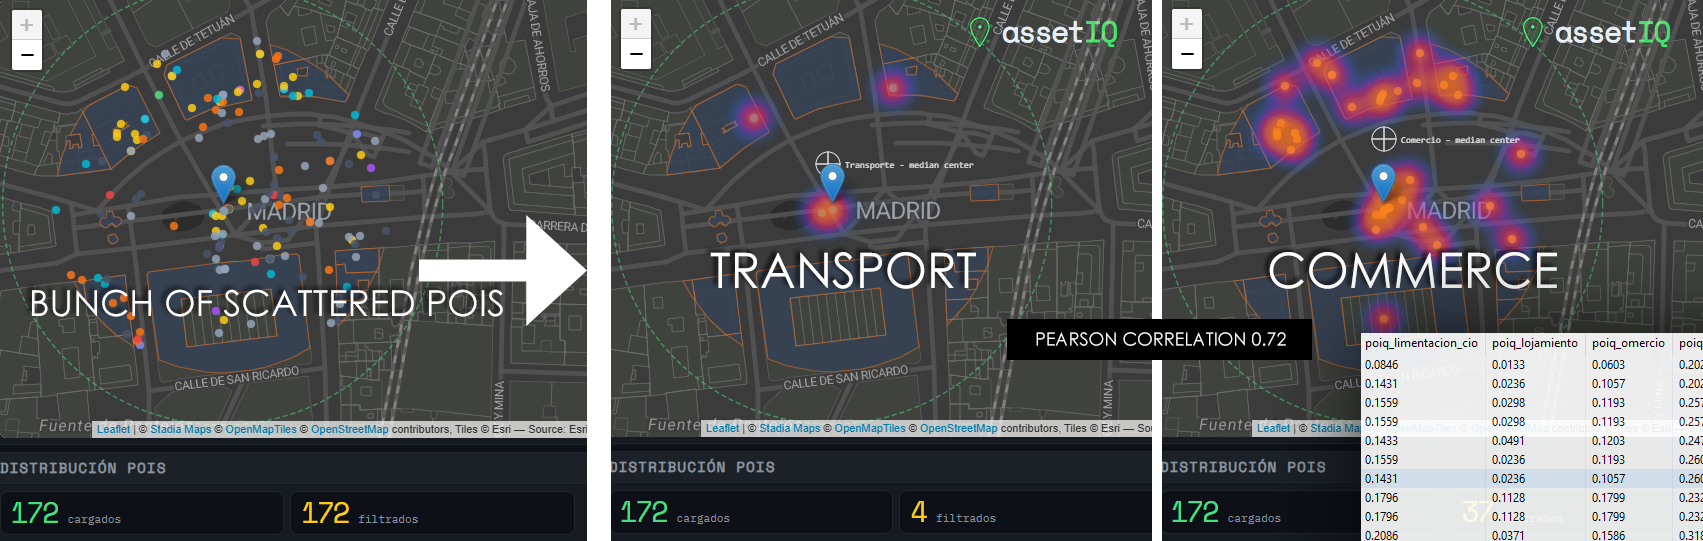
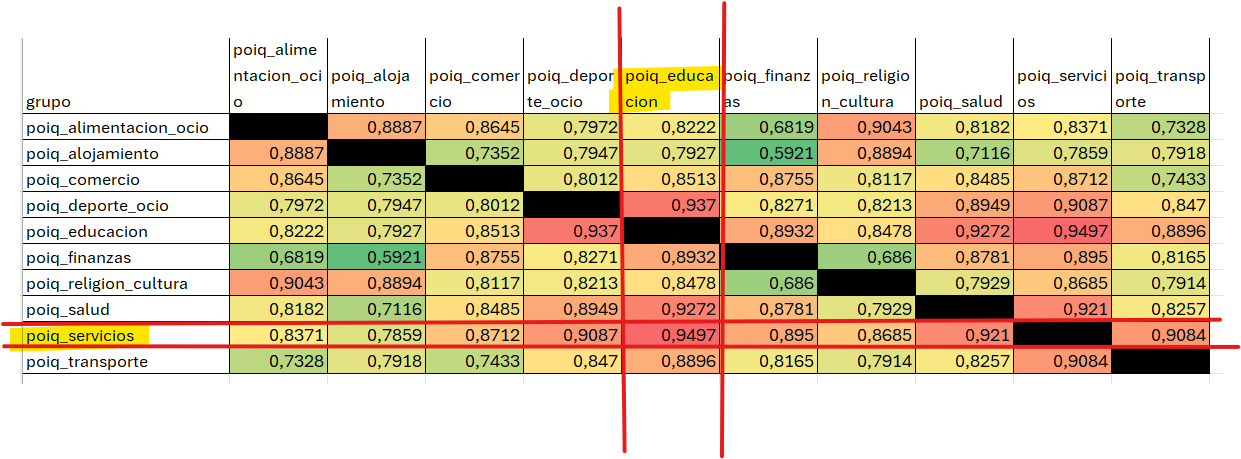
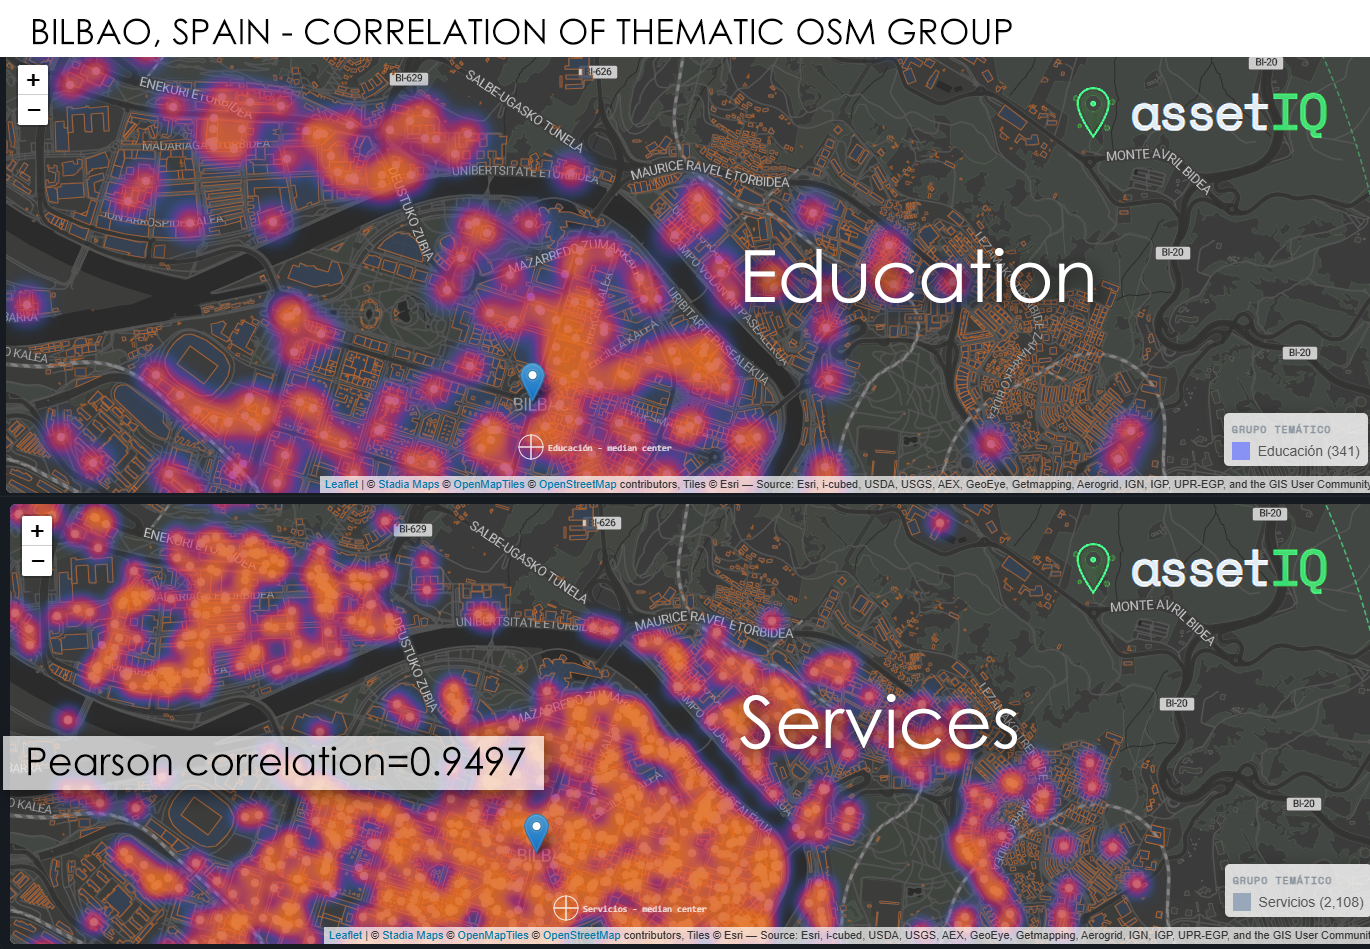
The core output is an attribute value called POIQ: a normalized 0–1 score assigned to every building footprint within the area of interest, derived from a Kernel Density Estimation of the selected thematic group. A building in a dense retail corridor scores close to 1. An isolated residential block far from any commerce scores close to 0. This transforms thousands of individual points — which in raw form tell you very little — into a single, interpretable attribute per building, ready for downstream modelling, valuation, or site selection.
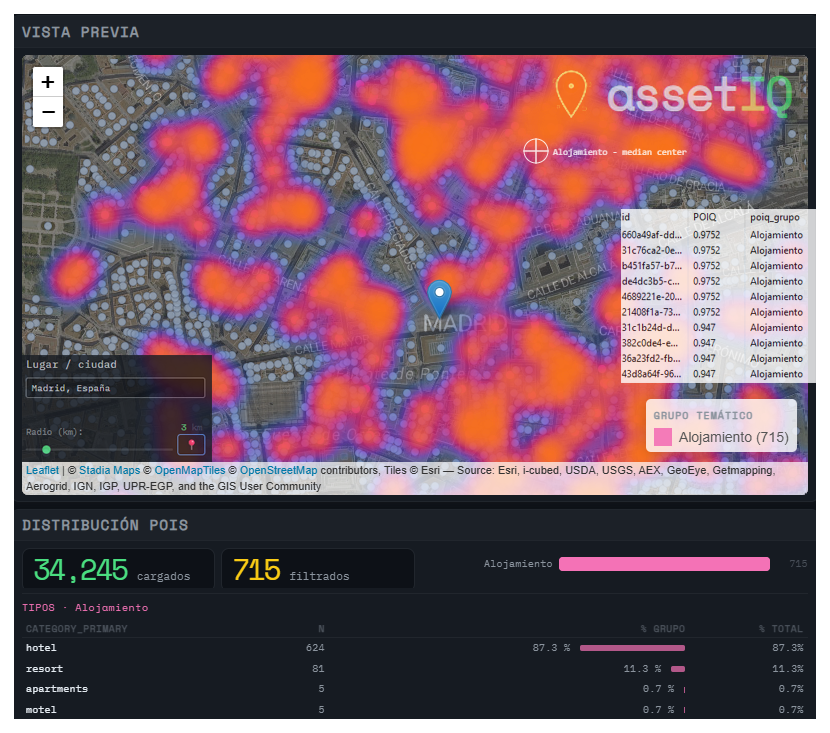
A companion Median Center marker identifies the geographic centroid of maximum concentration for the selected group, giving a precise, reproducible anchor for the activity zone rather than a subjective description.

Who is it for?
The most immediate use cases sit in industries where location is a core value driver:
Real Estate & Property Valuation — retail proximity, hospitality density, and financial services concentration are established drivers of commercial and residential yield. POIQ provides a quantified, reproducible variable to include directly in hedonic pricing models or investment scoring frameworks.
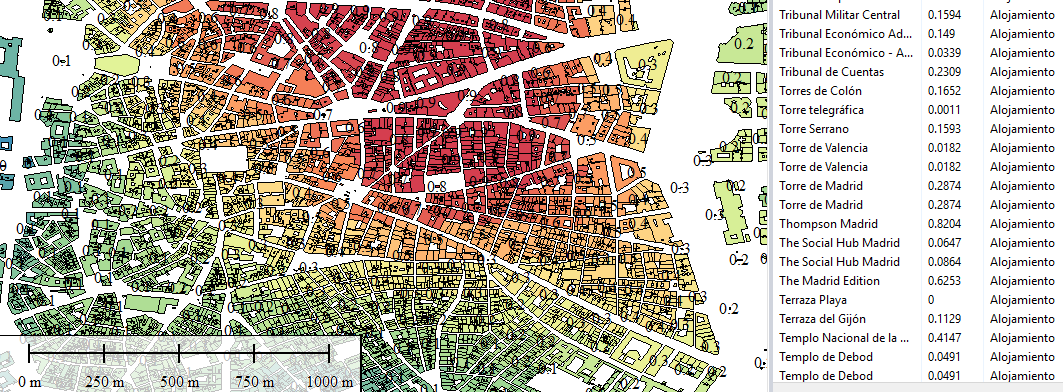
Telecommunications & Network Planning — coverage prioritization, site acquisition for small cells or retail outlets, and churn modelling all benefit from understanding which buildings sit inside high-activity commercial ecosystems versus which are isolated. POIQ adds a demand-side spatial signal to network infrastructure decisions.
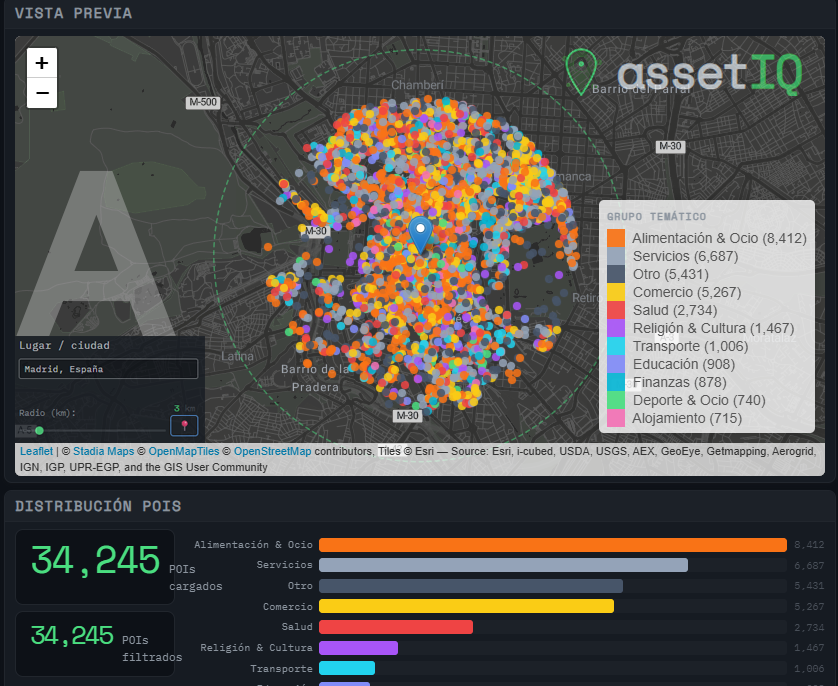
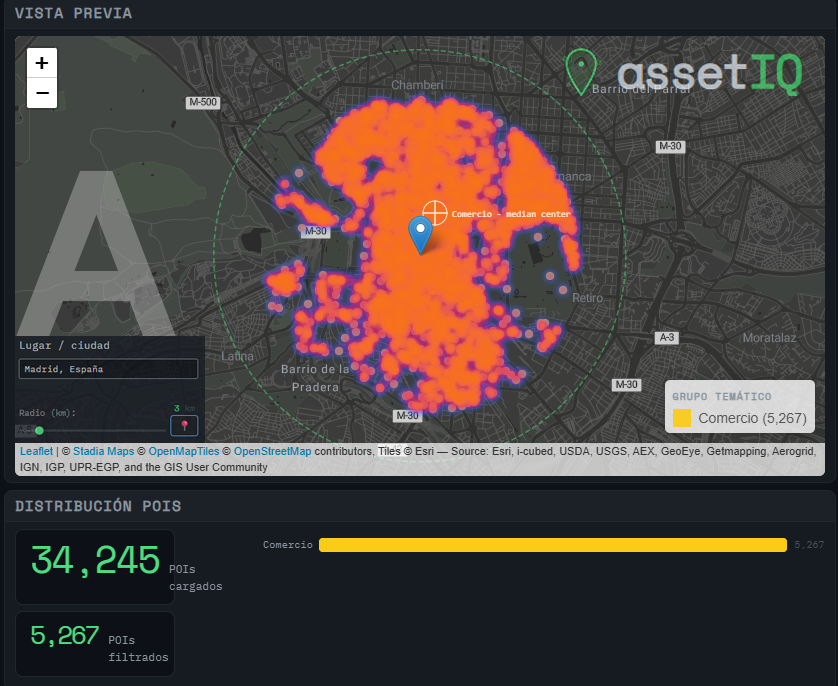
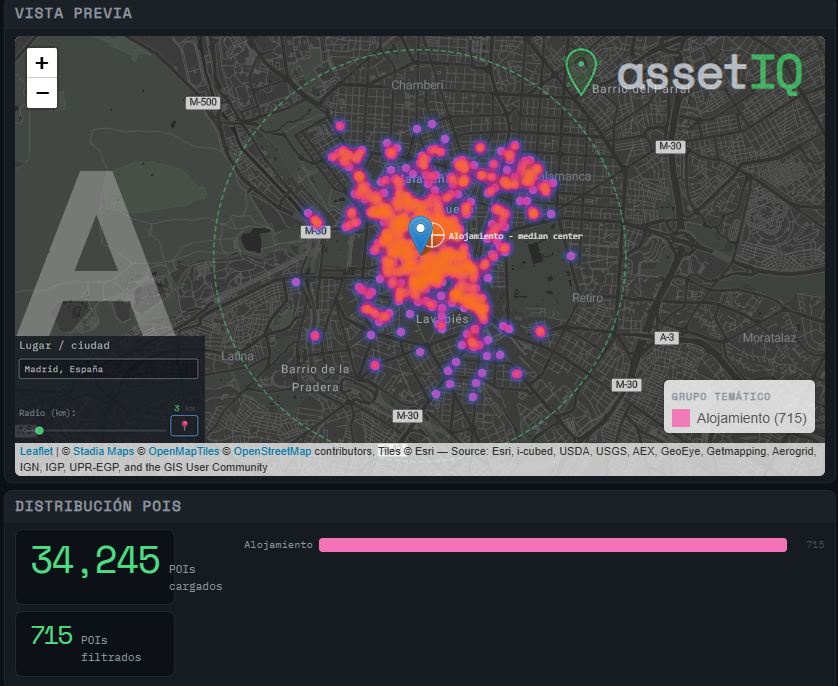
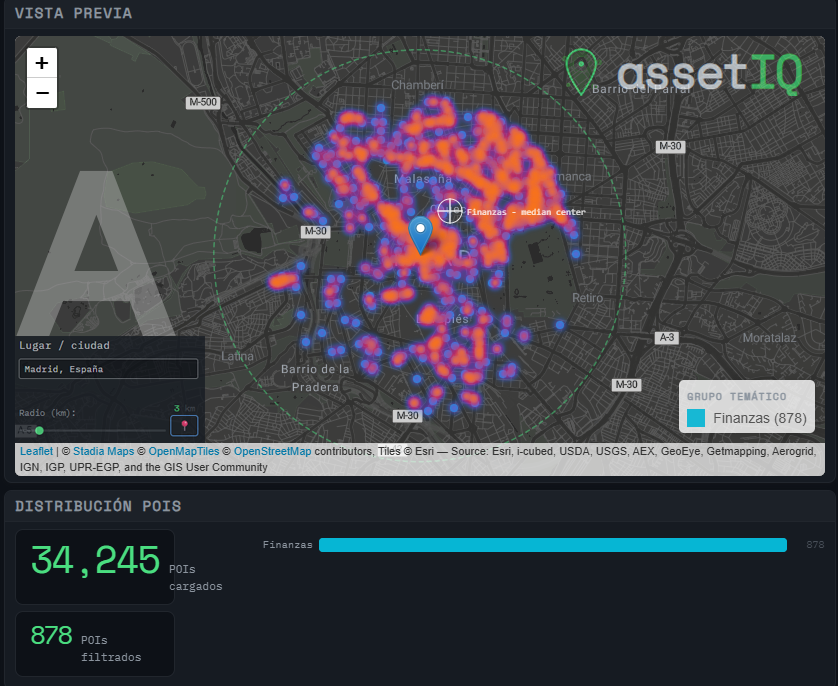
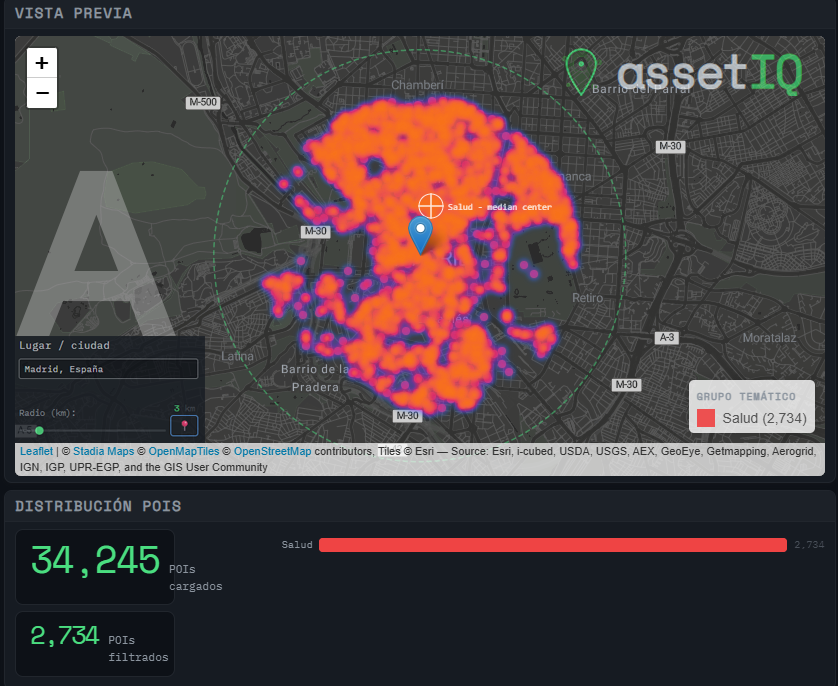
Retail & Franchise Expansion — identifying whether a candidate site is surrounded by complementary commerce (a food cluster that attracts footfall) or by competing category saturation is exactly the kind of micro-level distinction assetIQ makes visible.
Urban Planning & Consultancy — tracking how thematic POI density shifts across a corridor over time, or comparing two neighborhoods before and after an infrastructure intervention, becomes a structured, repeatable workflow.
Insurance & Risk — the presence of hospitality, nightlife, or financial services clusters correlates with foot traffic, vandalism exposure, and commercial risk profiles. POIQ can serve as a spatial covariate in risk scoring models.
Data sources and technology
Overture Maps Foundation is a collaborative open-source mapping initiative founded by AWS, Meta, Microsoft, and TomTom under the Linux Foundation, combining brand-verified location data with open contributions to produce a globally consistent POI dataset. Recent releases have incorporated data from Foursquare Open Source Places, adding millions of new POIs to expand coverage, with each record licensed under either Apache 2.0 or CDLA 2.0 depending on source (building footprints come from the Overture Buildings theme).
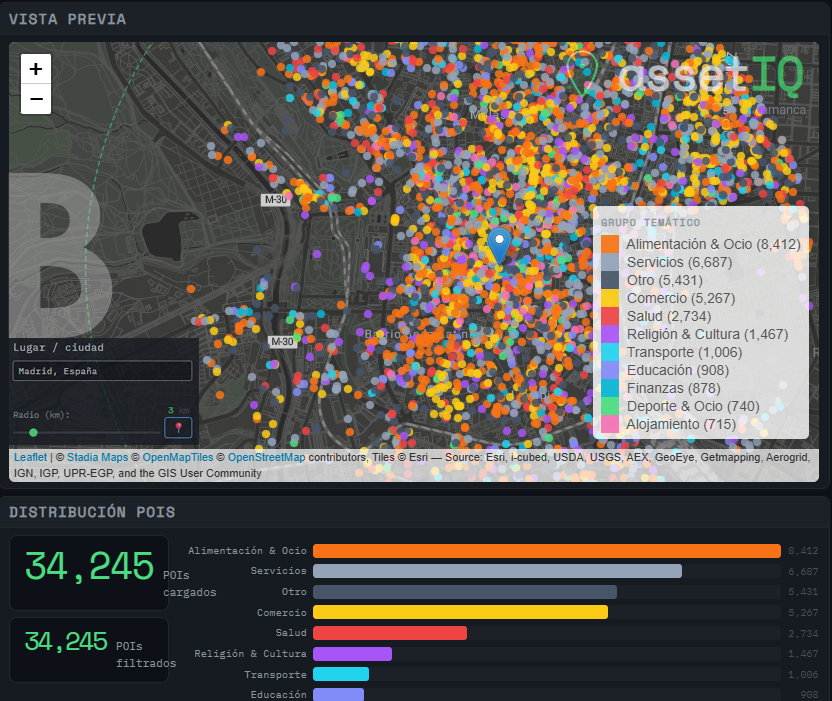
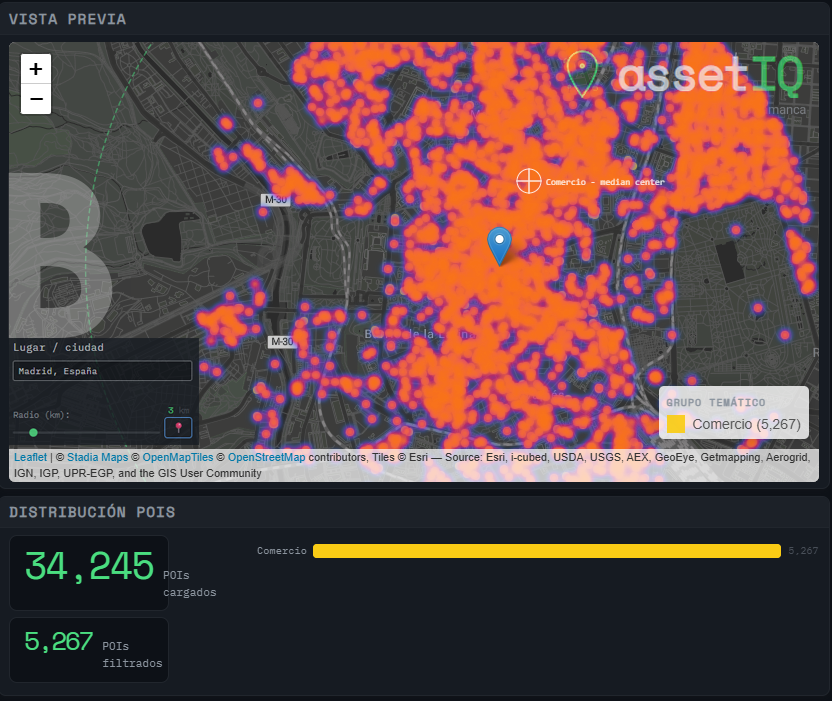
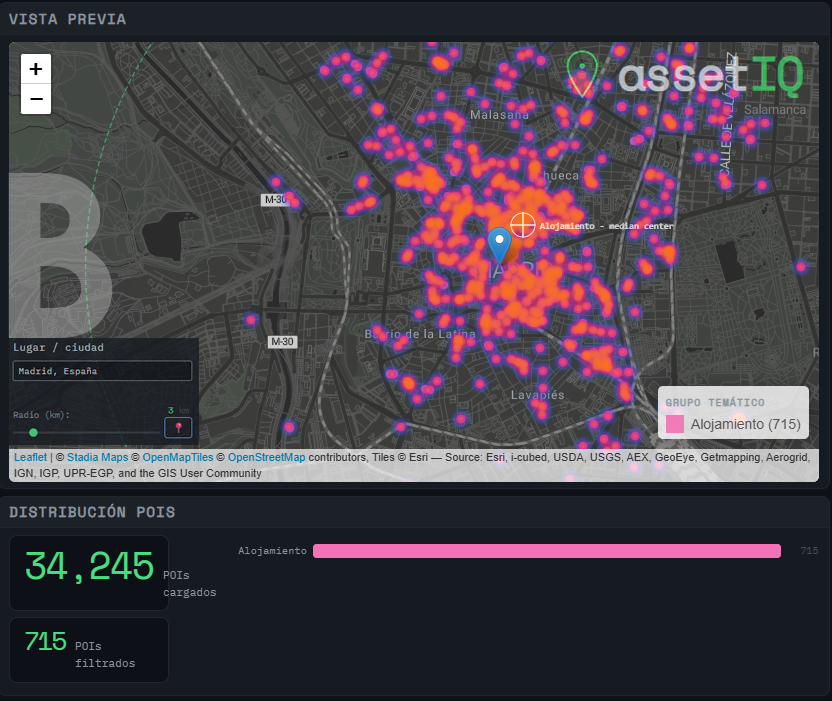
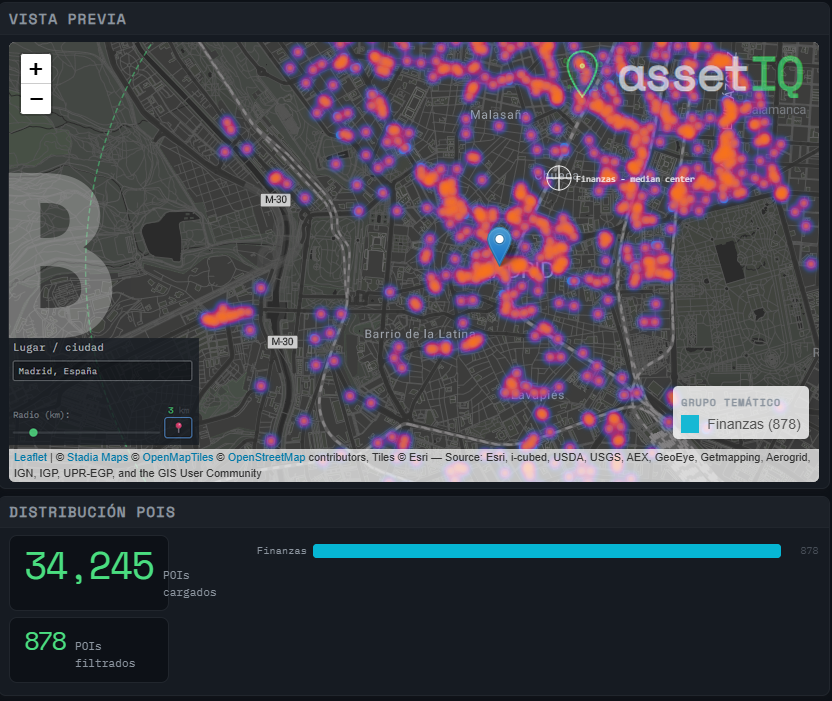
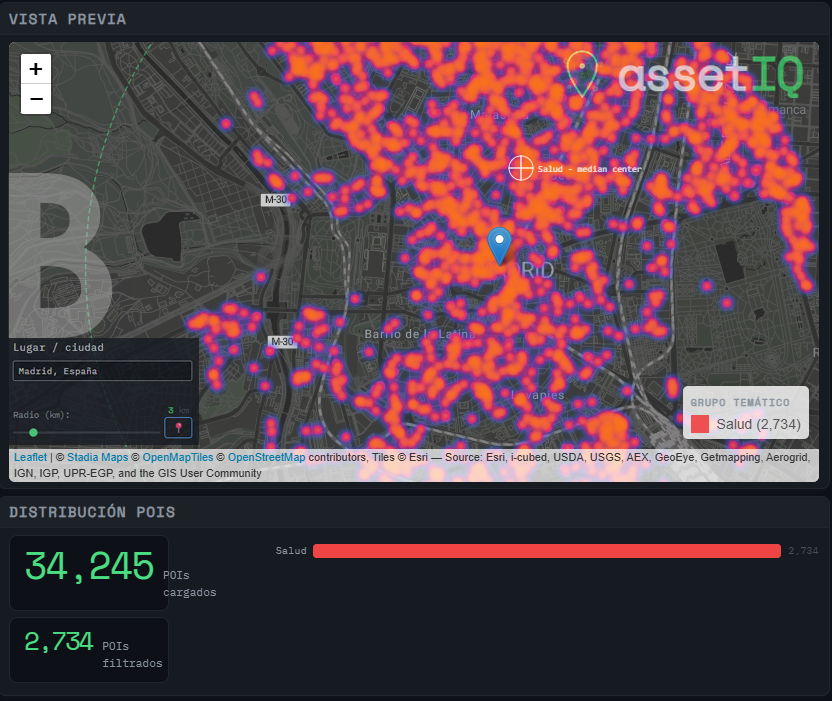
The application is written entirely in R, using Shiny for the interactive interface, DuckDB with the httpfs extension for serverless remote querying of GeoParquet files directly from S3, sf for spatial operations, and MASS for kernel density estimation. No data is downloaded to disk during analysis — DuckDB streams only the rows that fall within the bounding box of interest, making even large-radius queries tractable in under two minutes.
Outputs are exported as GeoPackage (.gpkg) — an OGC-standard format readable by QGIS, ArcGIS, and any GIS-capable pipeline — with separate layers for POIs (full attribute table including category taxonomy, confidence score, brand, contact, and address fields), building footprints with the POIQ field in the attribute table, and the Median Center point. GeoJSON export is straightforward from any of these layers for web or API integration.
Limitations
The quality of any POIQ score depends directly on the completeness and classification accuracy of the underlying POI data. Independent analysis of the Overture Places dataset has found that while coverage of major branded locations is strong in high-income markets, smaller independent businesses and coverage in less-mapped regions can be uneven — with some brand-country combinations showing coverage ratios well below the ideal threshold. The confidence field provided by Overture (0–1, representing the estimated probability that a place actually exists at the reported location) is preserved in the output and can be used to filter or weight results downstream.
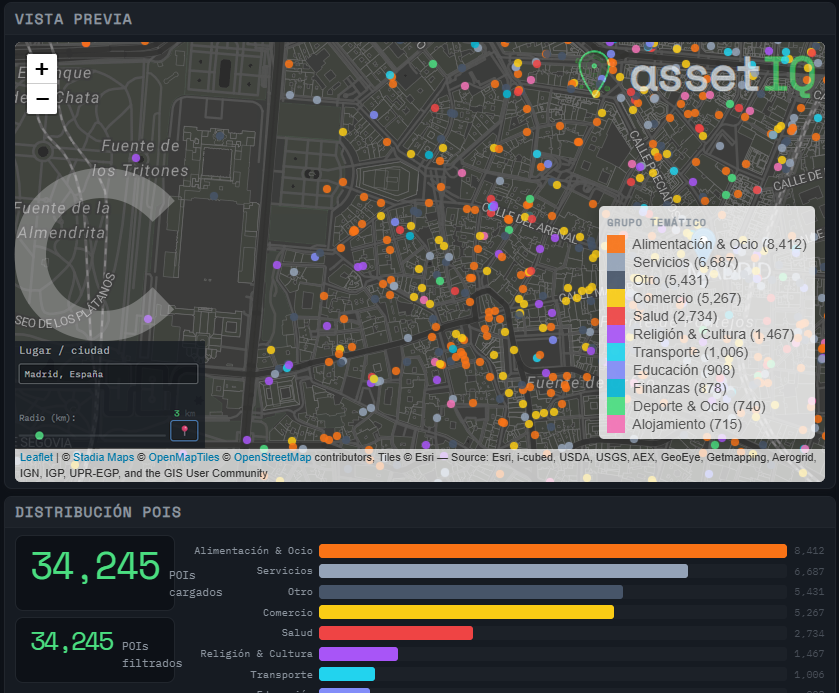
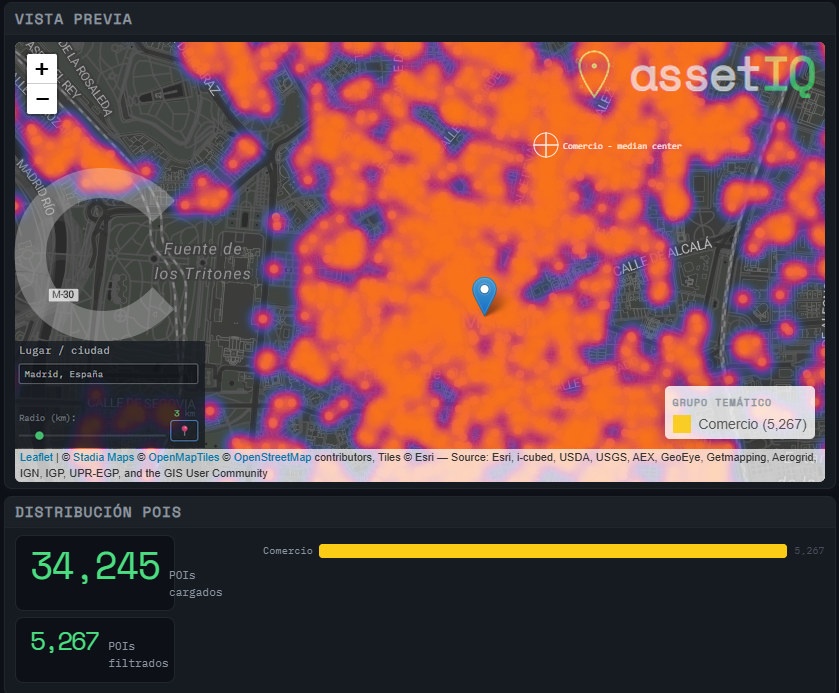
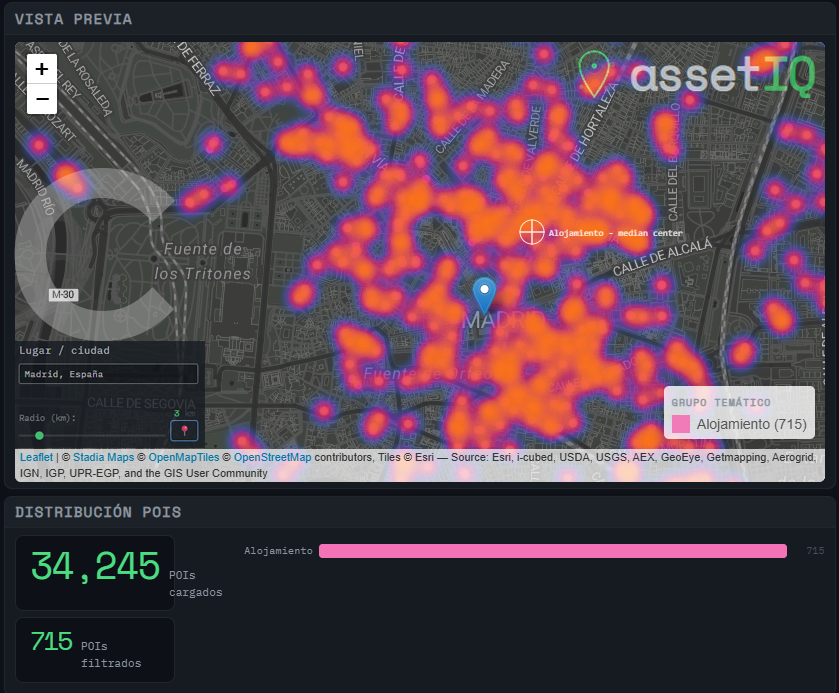
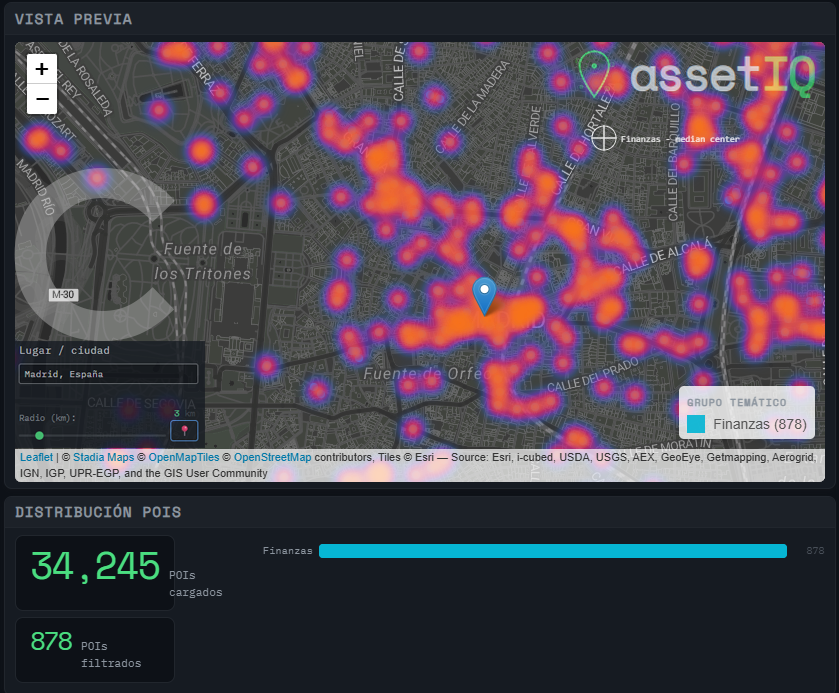
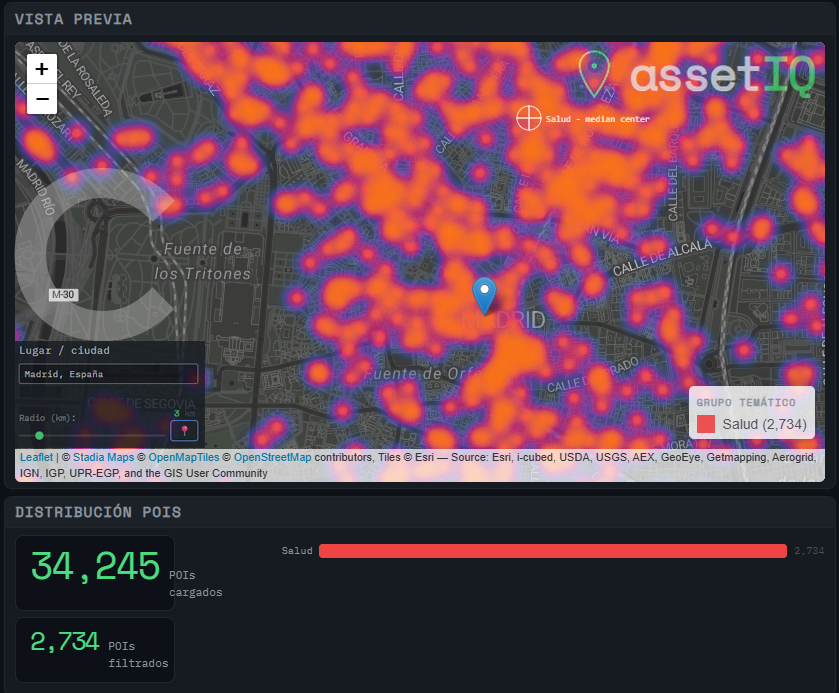
The thematic classification layer in assetIQ — mapping Overture’s basic_category taxonomy to eleven groups — is a deliberate simplification. Edge cases exist: a hospital pharmacy classified under Health rather than Retail, a hotel gym that could sit in either Accommodation or Sport. These classification boundaries should be treated as configurable starting points rather than ground truth.
Finally, POIQ is a relative index within a given area of interest, not an absolute score. A POIQ of 0.8 in a 500m radius around Puerta del Sol is not directly comparable to a POIQ of 0.8 in a 5km radius around a suburban retail park — the denominator changes with the search parameters.
Interested?
assetIQ is built for analysts, developers, and decision-makers who want to move from “there are lots of restaurants nearby” to “this building sits at the 94th percentile of Food & Drink density within its competitive set.” Ping me if you want to know more. Download this sample, simbolize it on your own and let me know if it suits you!
Built with R · DuckDB · Overture Maps
A Geospatial solution for everybody!
One more case study: TT


Alberto C.
GIS analyst
https://overturemaps.org
https://www.openstreetmap.org/
https://posit.co/download/rstudio-desktop
https://www.bluemarblegeo.com/global-mapper/

