
Dudé hasta el último momento de publicar este mapa y es que la falta de criterio hace que se tomen elecciones equivocadas, como pensar que la pandemia ha finalizado cuando ni mucho menos es el caso. Ayer mismo murieron 30 personas en Madrid. 30 familias destrozadas.
Tag Archives: analisis
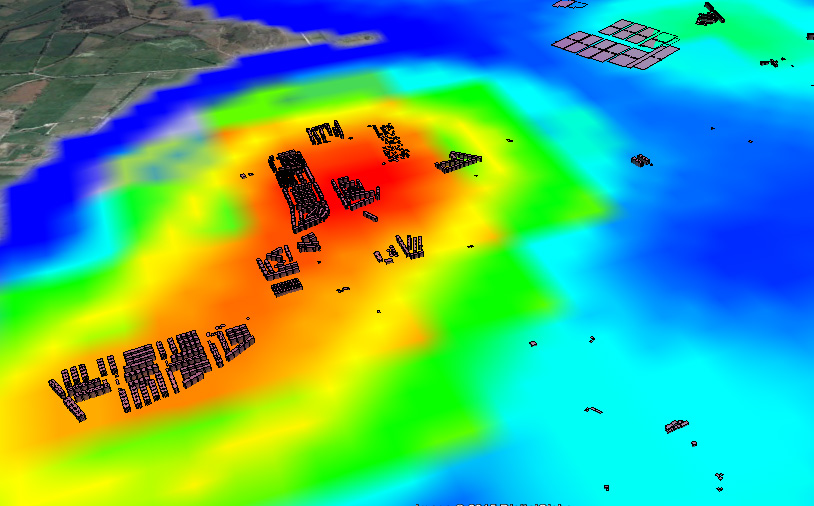
CORONOVIRUS ANÁLISIS MADRID (updated 20201029)

Según el enfoque, los resultados parecen ambiguos. En todo caso, cuando no está claro el tema, lo mejor es la precaución y en la Comunidad de Madrid podríamos tener en el mejor de los casos a una suicida como presidenta, Isabel “DEATH” Ayuso y sus decisiones no parecen contradecir esto. Lo peor es que detrás de sus decisiones están muchos millones de personas, no solo en Madrid.
Google Earth Engine y los incendios de verano: el caso de Cadalso de los Vidrios, Madrid (Julio 2019)

Gracias a la inestimable ayuda de mi compi de co-working Pablo Martín -ingeniero Forestal- con Google Earth Engine hemos modelado este NBR (Normalized Burn Ratio) que usa los canales NIR y SWIR de Sentinel-2 para medir la severidad del incendio de la semana pasada en mi pueblo, Cadalso de los Vidrios (Madrid, España). Rozamos la tragedia en lo personal pero sin duda fue terrible a nivel material. Tardaremos décadas en revertir este funesto incendio…
Change detection – Detección de cambios en polígonos
THE PROCEDURE: Centroids of buildings; Spatial join showing presence-absence, considering a 10m accuracy threshold, meaning if the centroid has not moved more than 10m, its the same building. If the centroid in 2012 is not in 2014, its considered as demolished. If a new centroid appears its considered new building.
Taxing the sun?. Yes, in Spain this seems to be possible.
Absolutely ashamed by my government’s insane policies on this regards, Spain is now (…) attempting to scale back the use of solar panels – the use of which they have encouraged and subsidized over the last decade – by imposing a tax on those who use the panels. The intention is clearly to scare taxpayersContinue reading “Taxing the sun?. Yes, in Spain this seems to be possible.”
Pearson correlation and GIS
Do these two variables have a correlation?. To answer this important question first of all we have to know that only if it’s a linear relationship and there are no outliers we can take advantage of Mr Pearson’s correlation statiscal tool. If i love chocolate, does this mean i have tendency of being chuby? orContinue reading “Pearson correlation and GIS”
Remote Sensing, Photogrammetry, Lidar and Landuse IGN Spain
A few more lines for leting you know again that i passed this other course just now in Instituto Geográfico of Spain (IGN). Remote Sensing, Photogrammetry, Lidar and Landuse, a comprehensive 40h update on relevant information i need tu use on a daily basis. This ‘update’ helps me to better understand what i am working with andContinue reading “Remote Sensing, Photogrammetry, Lidar and Landuse IGN Spain”
HTML High resolution DTM visualization using QGIS
This QGIS Plugin, Qgis2threejs, exports terrain data, map canvas image and vector data to your web browser!! All you have to do is opening the DTM in QGIS (2.4.0 Chugiak), go to plugins library and install Qgis2threejs. Once its installed you will see this icon on screen and you will need to clic on it. ThenContinue reading “HTML High resolution DTM visualization using QGIS”
Analyse des emplacements réservés à la livraison sur voirie: NANTES
*Désole pour mon français, si vous voulez on peut parler en anglais ou espagnol. La première chose qu’il faut faire c’est télécharger le jeu de données au site: http://data.paysdelaloire.fr/donnees/ Thématique : Mobilité Le jeu propose la géo-localisation des emplacements réservés à la livraison sur voirie dans un secteur limité de la ville de Nantes. Ces aires permettentContinue reading “Analyse des emplacements réservés à la livraison sur voirie: NANTES”
Projets éoliens en Loire-Atlantique
C’est vraiment magnifique l’ouverture des données publiques… Je vais décrire mon itinéraire pour mieux comprendre: Télécharger des données (Projets éoliens en Loire-Atlantique) Telecharger DTM (SRTM v4) Faire Carte d’ombrage (ArcGIS), Orientations (ArcGIS) et Inclinations (ArcGIS) pour mieux comprendre l’emplacement des moulins Faire Carte de densité (en mesurent la puissance du parc) Et maintenant la carte de densité en Global Mapper…Continue reading “Projets éoliens en Loire-Atlantique”
