El análisis de la distribución espacial de servicios financieros en centros urbanos —bancos, cajeros, aseguradoras, gestorías y corredurías de seguros— ofrece una lectura directa de la vitalidad económica y la accesibilidad financiera de un territorio. Mapear estos puntos con assetIQ sobre datos Overture Maps permite identificar en minutos dónde se concentra la actividad financiera, qué zonas quedan en la periferia del servicio y cómo se estructuran los ejes comerciales de cada ciudad. El mismo análisis es replicable para cualquier otra capa temática —alojamiento, salud, restauración, deporte— convirtiendo cada capital de provincia en un dashboard geoespacial comparable y reproducible.
Category Archives: Servicios de Mapas
El kernel que sigue al fuego: reconstruyendo el pulso de un fuego con datos satelitales
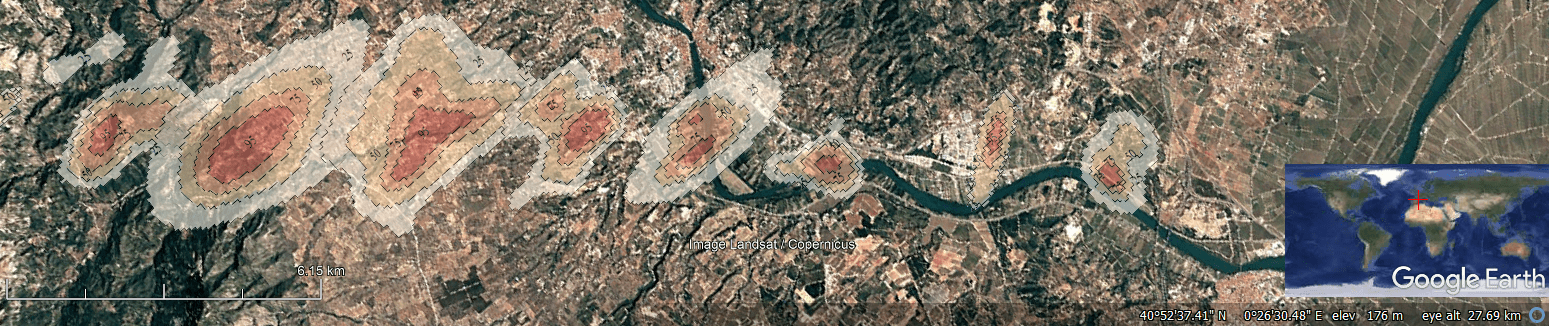
He pasado los últimos días construyendo Fire Kernel Tracker, una app en R Shiny que representa el ciclo de vida completo de un incendio forestal: desde el primer foco hasta la extinción, usando un kernel de densidad espacio-temporal ponderado por FRP (Fire Radiative Power) sobre detecciones satelitales VIIRS/MODIS de NASA FIRMS.
De NDVI a CO2e: un pipeline MRV de estimación de emisiones FLAG con GEE
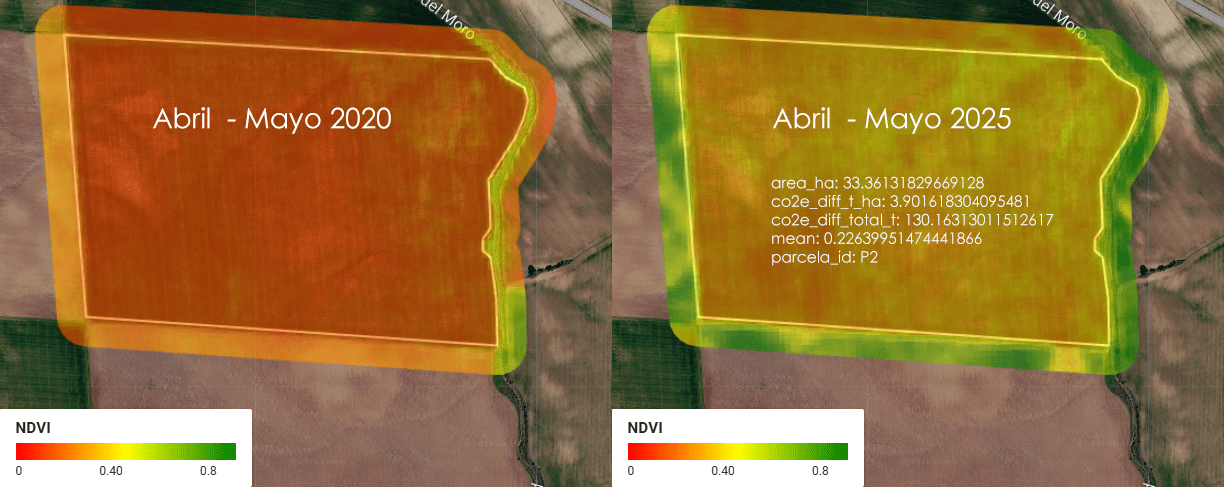
Imagina una empresa que se llama ACME. ACME es dueña de 5 parcelas de tierra en Almendralejo, Extremadura, España, donde se cultiva cereal (trigo, cebada, ese tipo de cosas). Entre las 5 parcelas, ACME tiene un total de 1.52 km² de tierra — para que te hagas una idea, eso es más o menos el tamaño de 300 campos de fútbol (a rzón de aproximadamente media hectárea por cada campo).
Bingham Canyon: El deslizamiento más grande de la historia minera moderna analizado con radar SENTINEL-1
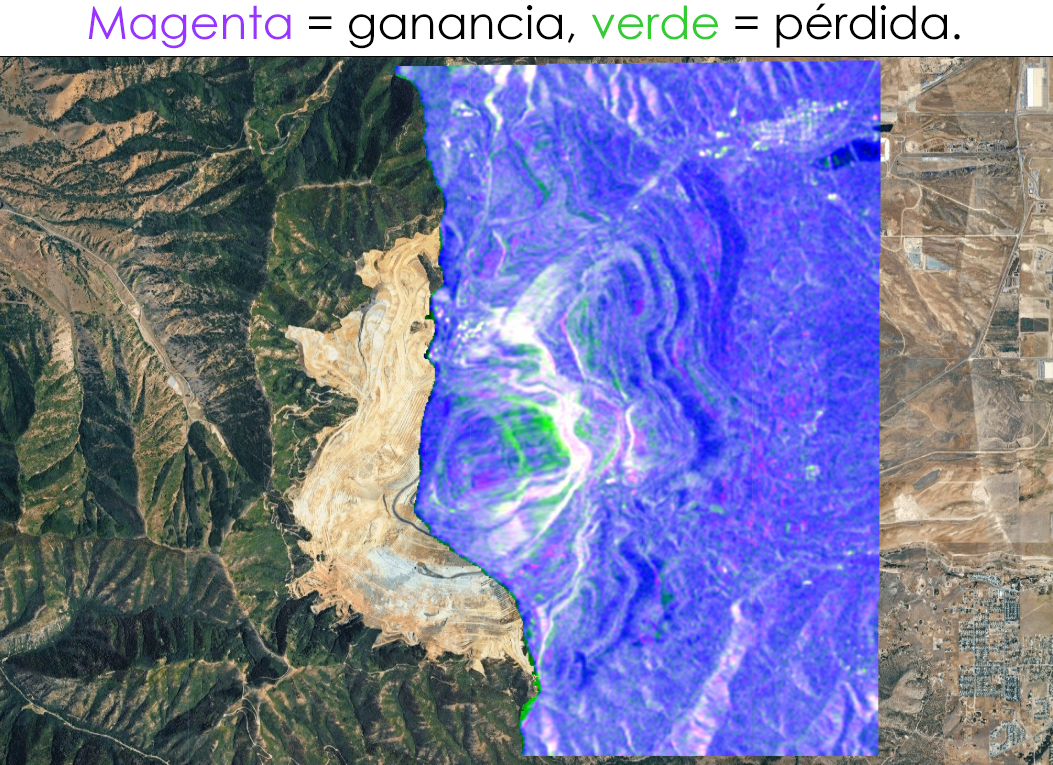
Análisis de cambios con SAR (Radar de Apertura Sintética) usando Sentinel-1 sobre la mina Bingham Canyon en Utah, donde ocurrió uno de los mayores deslizamientos de tierra de la historia minera el 10 de abril de 2013.
Time Series Analyzer: Análisis multitemporal de índices espectrales en Google Earth Engine
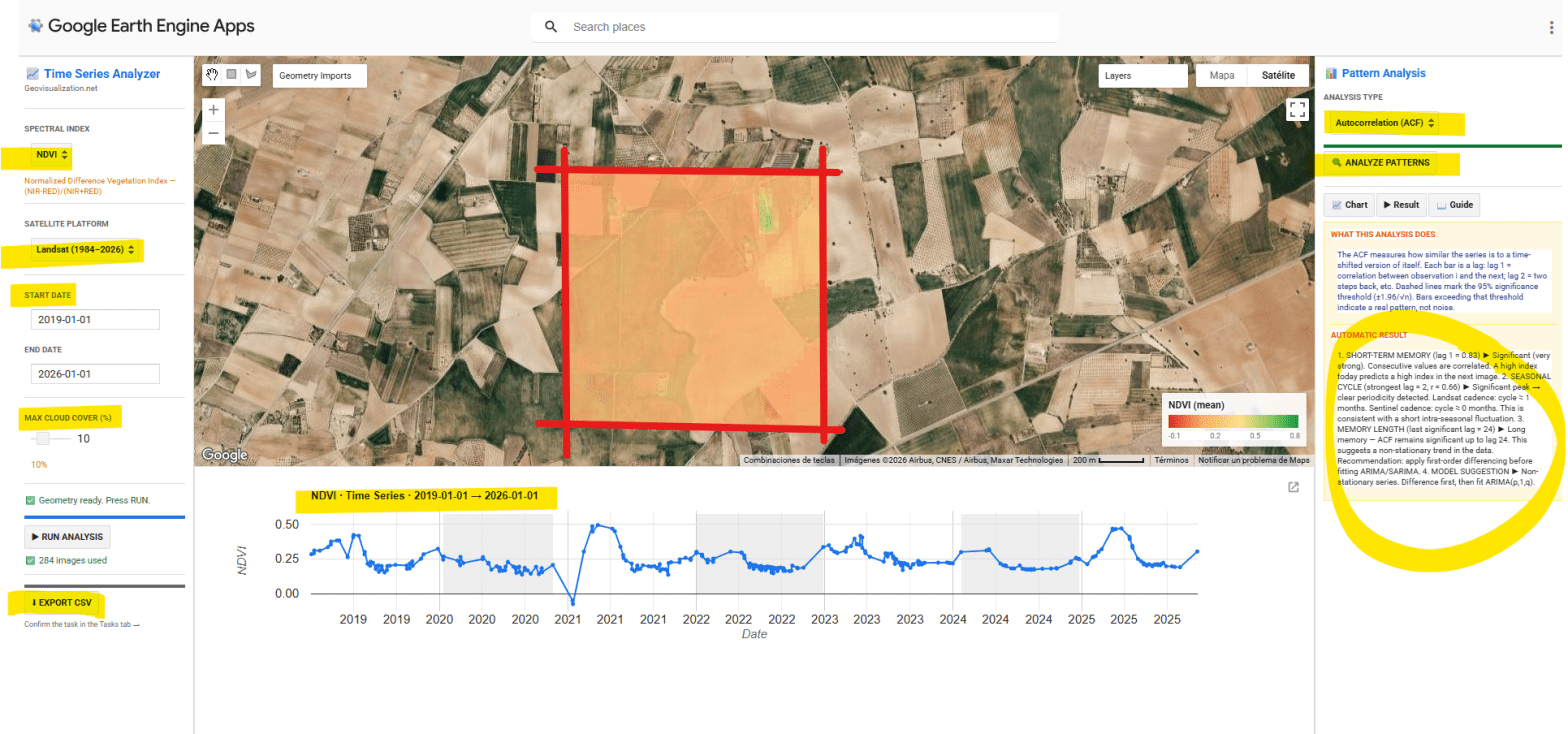
He desarrollado una aplicación interactiva en Google Earth Engine para la extracción y análisis estadístico automático de series temporales de cinco índices espectrales (NDVI, EVI, SAVI, NDWI y NBR) sobre cualquier geometría definida por el usuario en cualquier sitio del mundo. El objetivo es pasar de una imagen satélite puntual a una comprensión temporal del territorio: qué ha pasado, qué patrón subyace, y qué cabe esperar.
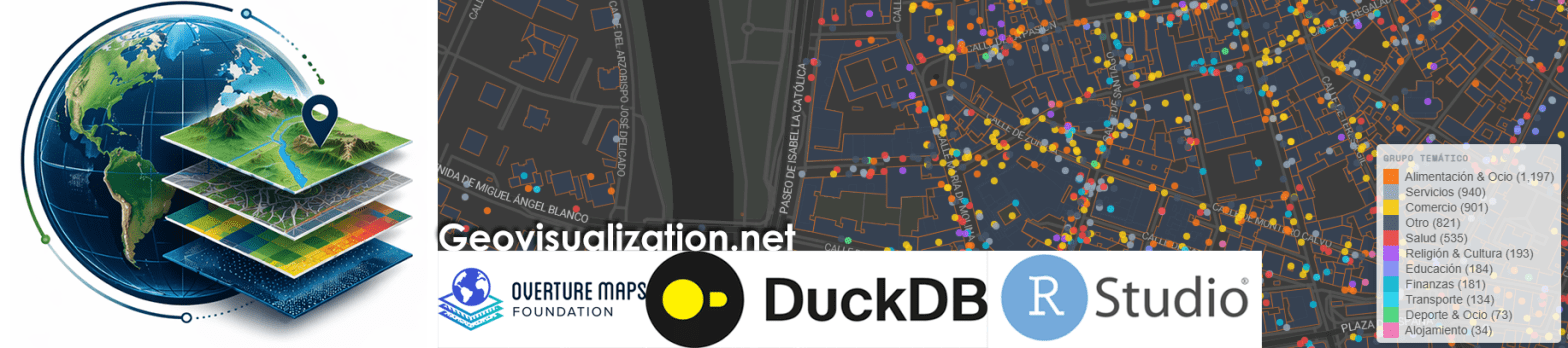
POI Intelligence for Urban Asset Analysis in RStudio: assetIQ
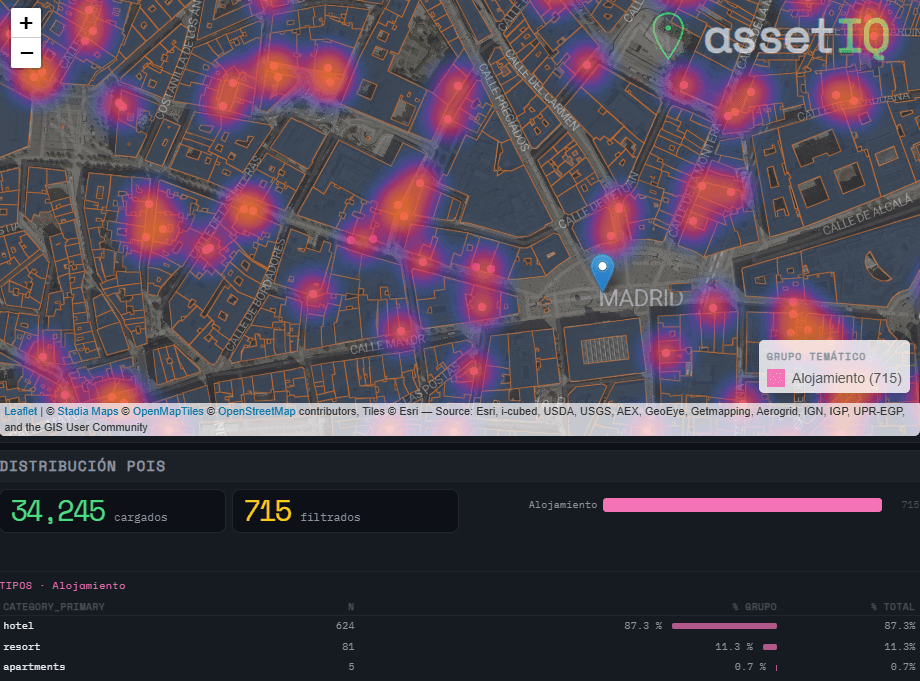
When analysing urban assets, there is genuine value in moving beyond generic neighborhood scores. The density of a coffee shop cluster, the proximity to a financial hub, or the concentration of accommodation around a transport node are signals that traditional datasets flatten into averages — or ignore entirely. assetIQ was built to change that. assetIQ is an R application powered by DuckDB and Overture Maps that extracts, classifies, and scores Points of Interest (POIs) for any location on Earth. You define a city and a search radius — from 100 meters to 25 kilometers — and the tool queries the Overture Maps Places dataset in real time, classifying each POI into thematic groups: Food & Drink, Retail, Health, Education, Transport, Accommodation, Financial Services, Leisure & Culture, Sport, and more.
The core output is an attribute value called POIQ: a normalized 0–1 score assigned to every building footprint within the area of interest, derived from a Kernel Density Estimation of the selected thematic group. A building in a dense retail corridor scores close to 1. An isolated residential block far from any commerce scores close to 0. This transforms thousands of individual points — which in raw form tell you very little — into a single, interpretable attribute per building, ready for downstream modelling, valuation, or site selection.
Bienvenido a Madrid Río, donde el carril único lo usa todo el mundo… pero solo la mitad lo usa bien
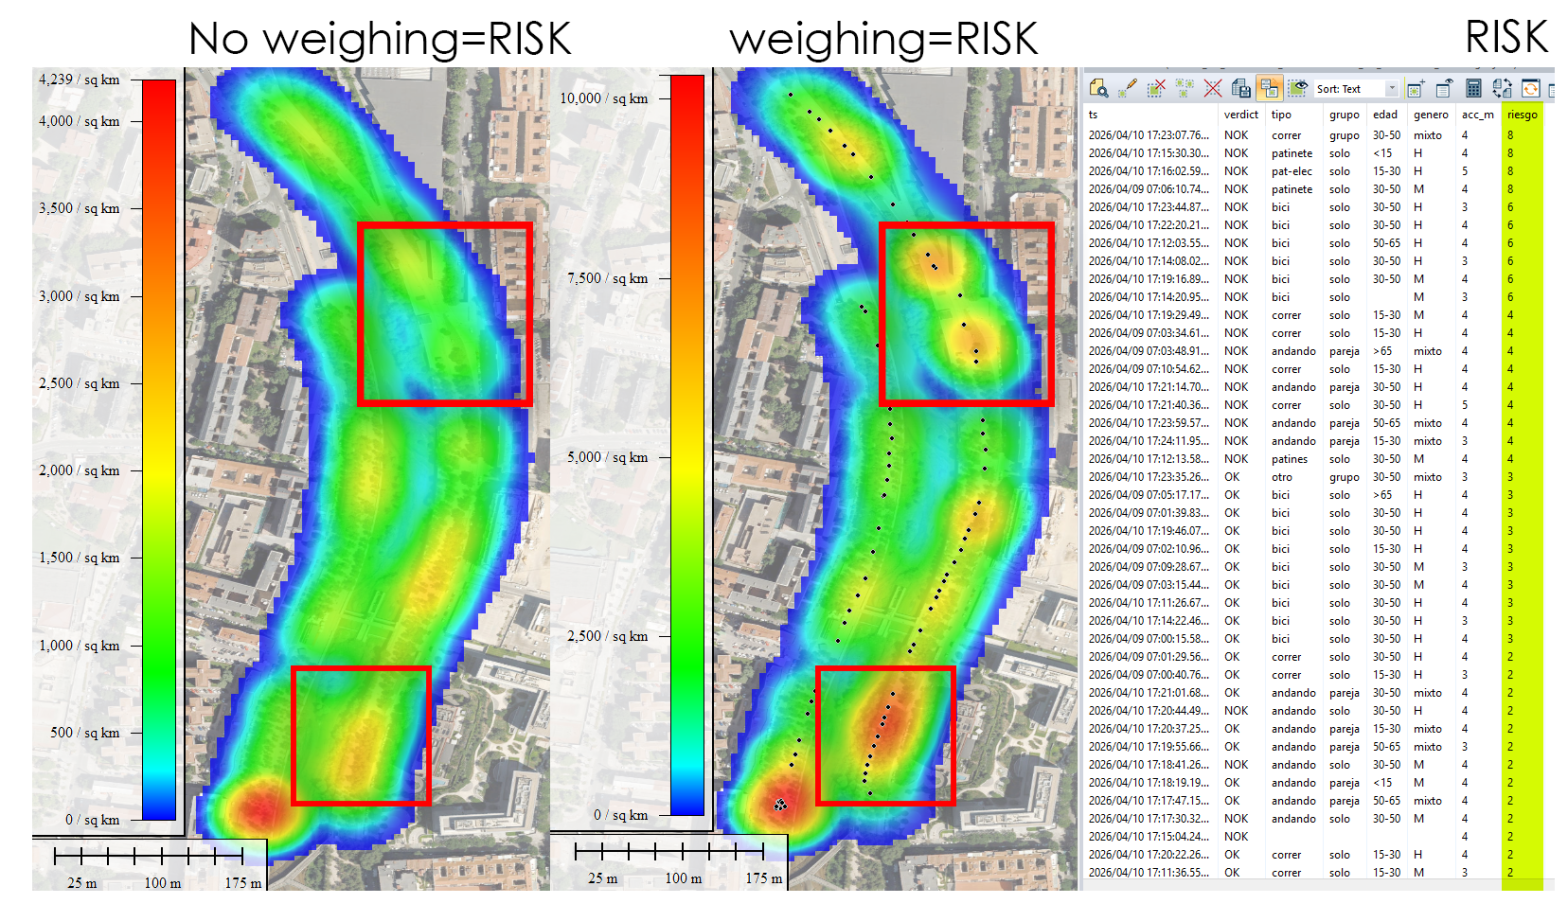
Y cuando eso ocurre, se genera un caos silencioso. Normalmente se resuelve en segundos con ese equilibrio dinámico tan mediterráneo que tenemos —un quiebro, una mirada, un gesto— pero no siempre. He visto bicis arrollar a personas que iban por su lado. Grupos andando en paralelo, bloqueando la vía entera. Patinetes a velocidad de vértigo a punto de llevarse por delante a un niño que, irónicamente, iba exactamente donde debía. Yo mismo llevo usando esta vía desde casi su inauguración, hace más de once años, y puedo decir que el problema no ha mejorado: ha crecido, a medida que el carril se ha llenado de nuevas tipologías de movilidad.
¿Qué quiero hacer? Quiero medir esto. Con rigor, con datos, y con herramientas actuales. Mi objetivo es retratar estadísticamente quién va en el sentido correcto y quién no, desagregando por tipo de movilidad, edad, género y comportamiento en grupo. ¿Son los ciclistas los que más incumplen, o los patinetes eléctricos? ¿La gente mayor es más respetuosa que los jóvenes? ¿Los grupos de tres o más personas son el mayor factor de caos? No lo sé aún. Pero lo voy a descubrir.
Agricultura de precisión (II). APP para integración con Catastro rural en España
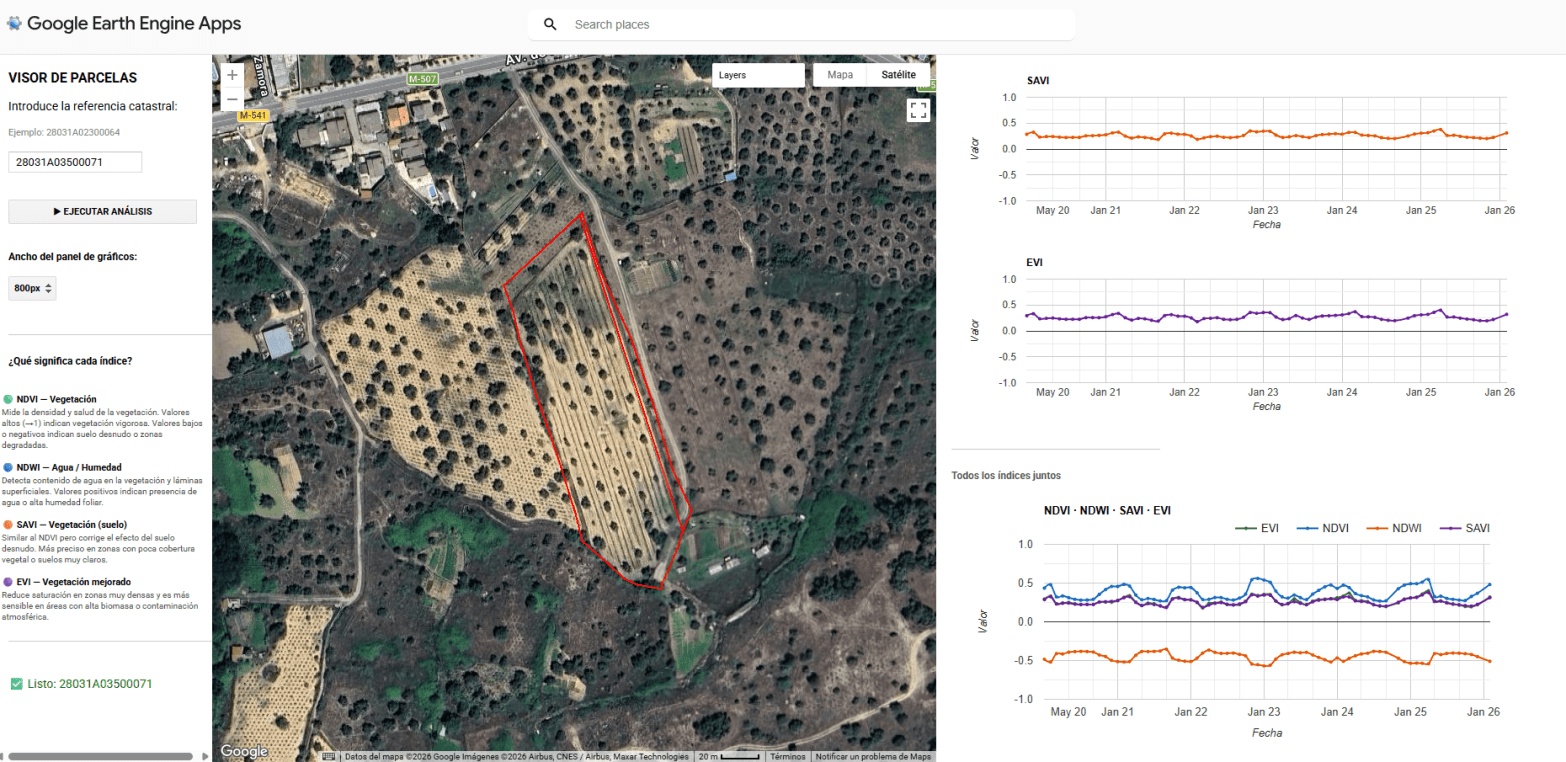
La convergencia entre el Big Data geoespacial y la administración pública ofrece una oportunidad sin precedentes para la optimización agronómica. La capacidad de procesamiento de Google Earth Engine (GEE), vinculada a la cartografía vectorial del Catastro rural, permite transformar las series temporales de misiones como Sentinel-2 en herramientas de diagnóstico directo sobre la parcela. Este enfoque desplaza el análisis de una observación puramente visual a una monitorización cuantitativa basada en la respuesta espectral de los cultivos. El núcleo de esta aplicación reside en la intersección geométrica de las parcelas catastrales con colecciones de imágenes multiespectrales. Mediante el uso de la API de JavaScript en GEE, se automatiza el cálculo de indicadores biofísicos críticos como el NDVI (Índice de Vegetación de Diferencia Normalizada), el NDWI (Índice de Agua de Diferencia Normalizada), el EVI (Índice de Vegetación Mejorado) y el SAVI (Índice de Vegetación Ajustado al Suelo). Estos índices no solo reflejan el vigor fotosintético, sino que permiten identificar anomalías de crecimiento, estrés hídrico o variaciones en la densidad foliar que son invisibles al ojo humano en las fases tempranas del ciclo fenológico.
Aventuras y desventuras de un geógrafo en “desarrollo”
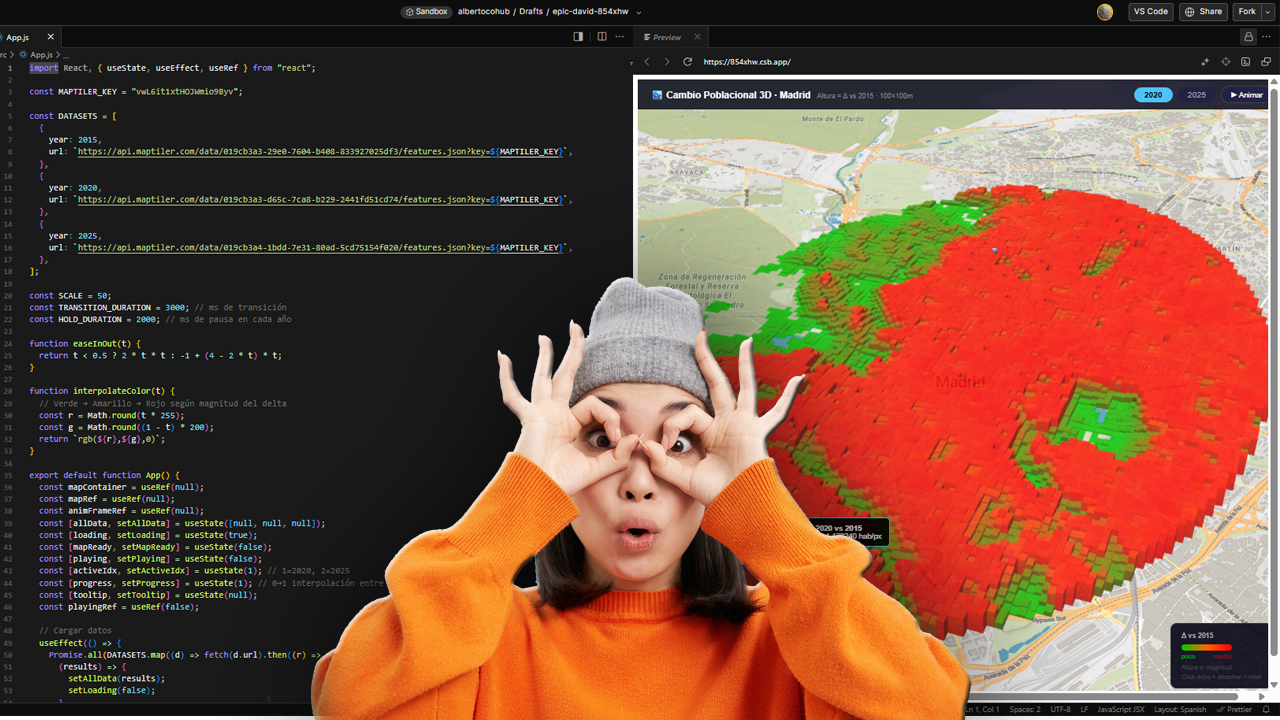
La cartografía siempre ha sido un oficio de precisión, paciencia y criterio espacial. Durante años, el flujo de trabajo de cualquier geógrafo pasaba inevitablemente por entornos de escritorio como ArcGIS Pro o QGIS: cargar capas, ajustar simbología, exportar mapas. Herramientas sólidas, probadas, indispensables. Pero algo está cambiando.
Cada vez más, el análisis espacial ocurre en la nube, en navegadores, en entornos de código. En anteriores post habéis visto algunos test/ideas/aplicaciones que he desarrollado con Javascript Google Earth Engine, que procesa imágenes satelitales a escala planetaria sin mover un solo archivo. Deck.gl y Maplibre renderizan millones de puntos en 3D directamente en el navegador. React convierte un mapa en una aplicación interactiva con pocas líneas de código.
¡Al final se nos quema la península este 2025!

Este agosto, España y Portugal han vivido una temporada de incendios excepcionalmente dura. En España, las llamas han calcinado ~382.000 hectáreas (más de seis veces la media reciente) y han dejado víctimas mortales; en Portugal, las superficies quemadas superan las 200.000 hectáreas, muy por encima del promedio 2006–2024 para estas fechas. El humo cruzó fronteras y degradó la calidad del aire a cientos de kilómetros.
