Trabajo desde hace años en aplicaciones que combinan datos abiertos de distinta procedencia para resolver un problema que parece sencillo y no lo es tanto: representar el modelo 3D de cualquier municipio español, con una altura que no sea un promedio inventado o procedural ni un valor por defecto según el número de plantas catastrales, sino una medición real extraída de la nube de puntos LiDAR del Plan Nacional de Ortofotografía Aérea.
Category Archives: geovisualizacion
Topografía desde el espacio: flujo completo de InSAR para generar un DTM con Sentinel-1
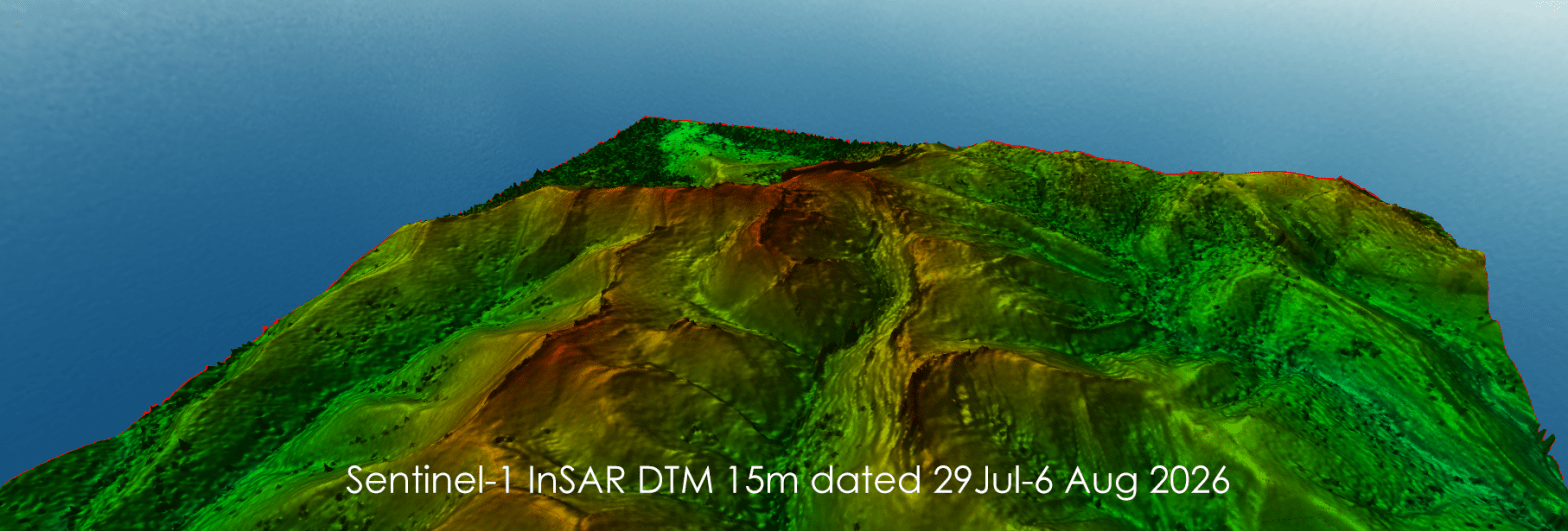
Hay una pregunta que me ronda desde hace tiempo: ¿hasta qué punto puede un analista GIS, sin presupuesto de misión espacial ni acceso a LiDAR propio, generar un Modelo Digital del Terreno con una precisión que supere a los DEM globales de libre acceso? La respuesta corta: sí se puede, pero el camino no es trivial. Este post documenta ese camino completo, con todos sus tropiezos incluidos, porque creo que el valor real de un tutorial está tanto en lo que sale bien como en lo que se rompe por el camino.
Geografía financiera de Castilla y León · análisis espacial de POIs Open Data 2026
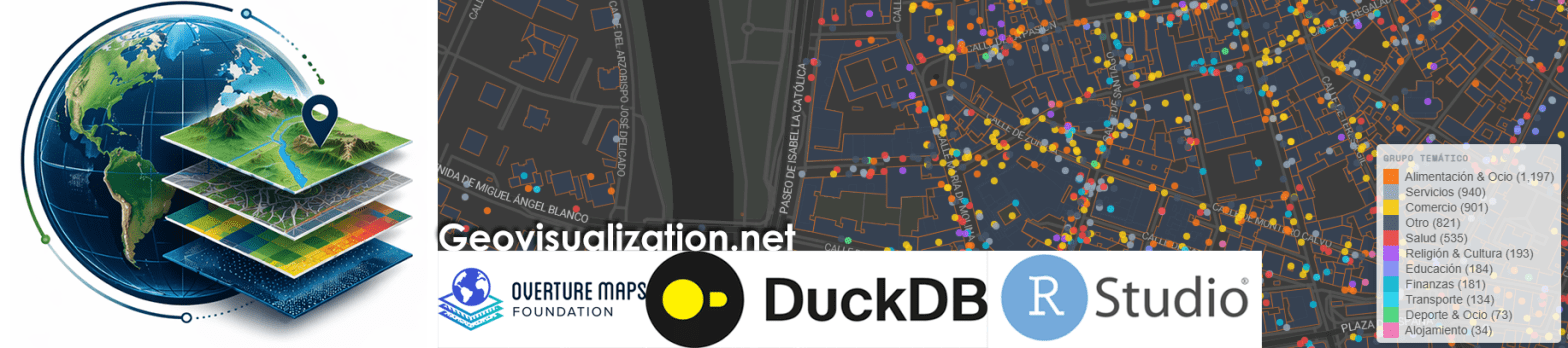
El análisis de la distribución espacial de servicios financieros en centros urbanos —bancos, cajeros, aseguradoras, gestorías y corredurías de seguros— ofrece una lectura directa de la vitalidad económica y la accesibilidad financiera de un territorio. Mapear estos puntos con assetIQ sobre datos Overture Maps permite identificar en minutos dónde se concentra la actividad financiera, qué zonas quedan en la periferia del servicio y cómo se estructuran los ejes comerciales de cada ciudad. El mismo análisis es replicable para cualquier otra capa temática —alojamiento, salud, restauración, deporte— convirtiendo cada capital de provincia en un dashboard geoespacial comparable y reproducible.
El kernel que sigue al fuego: reconstruyendo el pulso de un fuego con datos satelitales
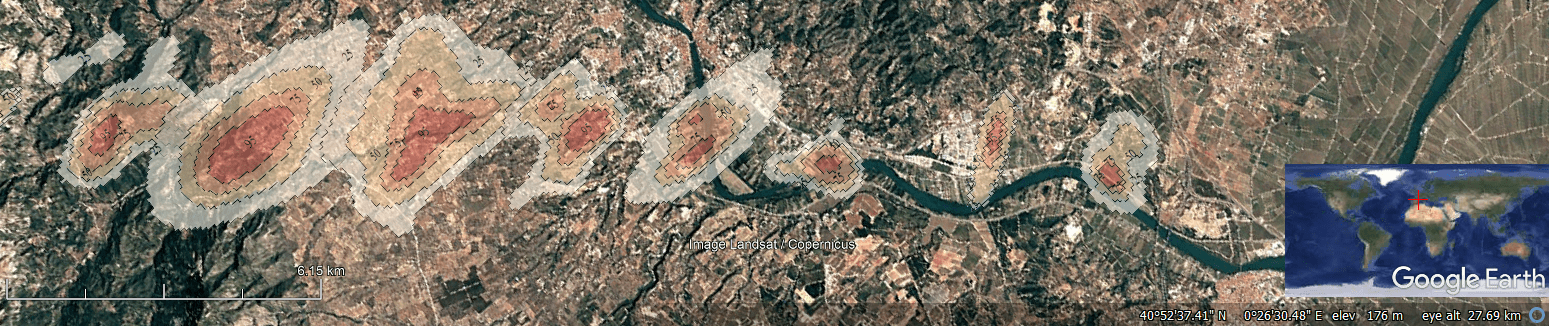
He pasado los últimos días construyendo Fire Kernel Tracker, una app en R Shiny que representa el ciclo de vida completo de un incendio forestal: desde el primer foco hasta la extinción, usando un kernel de densidad espacio-temporal ponderado por FRP (Fire Radiative Power) sobre detecciones satelitales VIIRS/MODIS de NASA FIRMS.
Super-resolution 1m vs ‘Google Maps de Incendios Forestales’ en Guadalajara, España 20260723
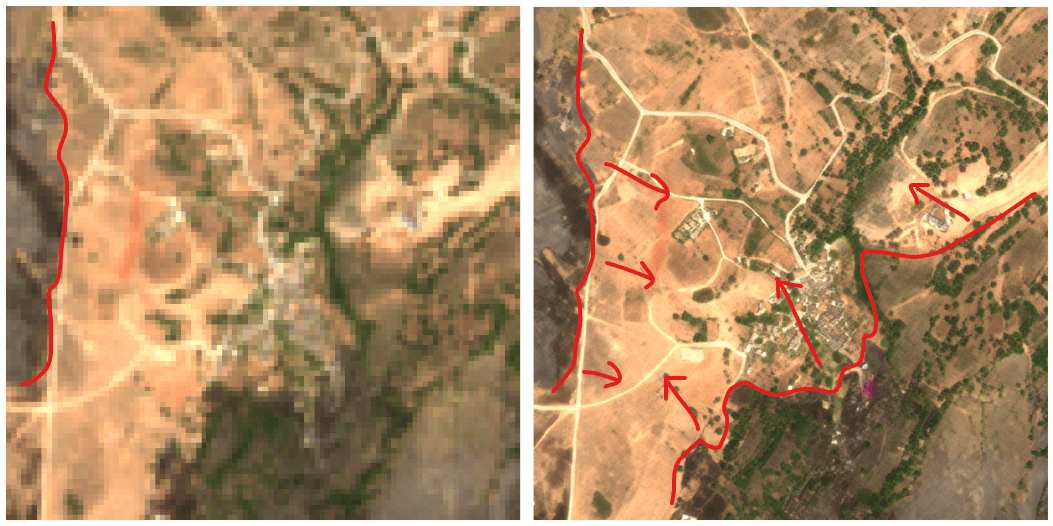
Parece que ya estamos llegando al final de este incendio pero se ha “comido” casi 32,000 ha! y me llamó la atención cómo lo tienen que haber pasado los habitantes de este pequeño pueblo de la zona llamado Las Navas de Jadraque que según Google Maps, se quemó enteramente… el fuego de la Sierra Norte de Guadalajara es exactamente ese tipo de incendio “mega” (más de 30.000 ha, nivel 2, decenas de pueblos evacuados) donde la cobertura mediática y las capas de datos rápidos tienden a generalizar y “tragarse” núcleos de población que en realidad sobrevivieron, sobre todo cuando hay defensa activa in situ.
De NDVI a CO2e: un pipeline MRV de estimación de emisiones FLAG con GEE
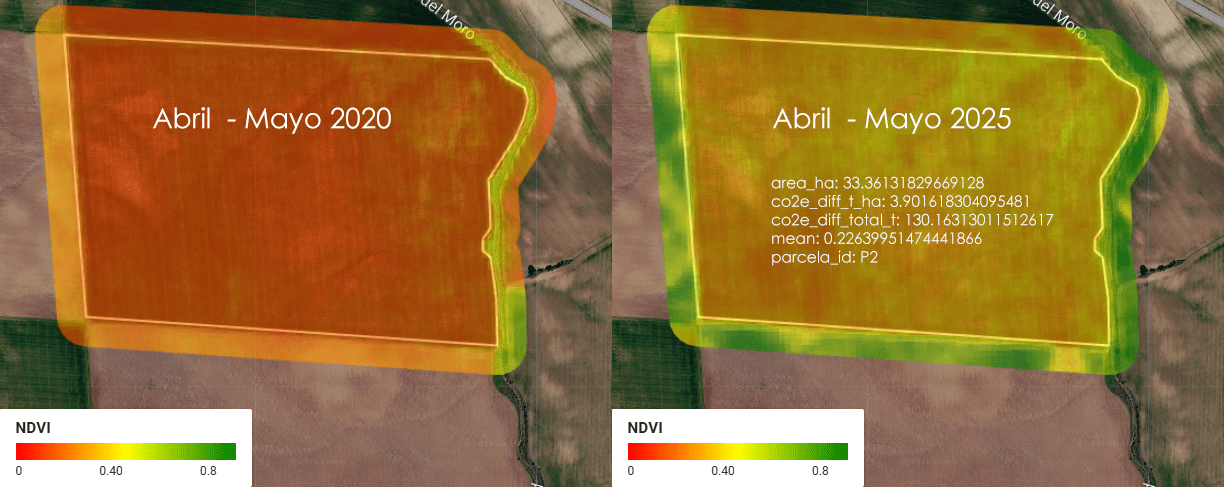
Imagina una empresa que se llama ACME. ACME es dueña de 5 parcelas de tierra en Almendralejo, Extremadura, España, donde se cultiva cereal (trigo, cebada, ese tipo de cosas). Entre las 5 parcelas, ACME tiene un total de 1.52 km² de tierra — para que te hagas una idea, eso es más o menos el tamaño de 300 campos de fútbol (a rzón de aproximadamente media hectárea por cada campo).
KALMAN RADAR TRACKER: SEGUIMIENTO DE BLANCOS AÉREOS
Cuando alguien me pregunta sobre radar, pienso sobre todo en radares montados en satélites (sesgo geospacial) pero en realidad hay mucho más, hoy voy a hablaros de de radares aeroportados, de filtros de Kalman y seguimiento de blancos aéreos en movimiento… ¡Qué interesante!
Lo primero que pienso no es en el radar en sí, sino en el problema que resuelve, porque ese problema lo llevo resolviendo de otra forma desde hace años sin llamarlo por su nombre técnico. Un radar mide la posición de un avión con ruido. Un GPS mide la posición de un coche con ruido. Un sensor SAR mide el desplazamiento del terreno con ruido. En los tres casos hay una señal real escondida detrás de mediciones que saltan, que tiemblan, que nunca coinciden exactamente con la trayectoria verdadera. Y en los tres casos la respuesta es la misma matemática: combinar lo que predice el modelo físico con lo que dice el sensor, ponderando cada fuente según cuánto te fías de ella.
VENEZUELA EARTHQUAKE RESPONSE using DuckDB, Overture Maps and R
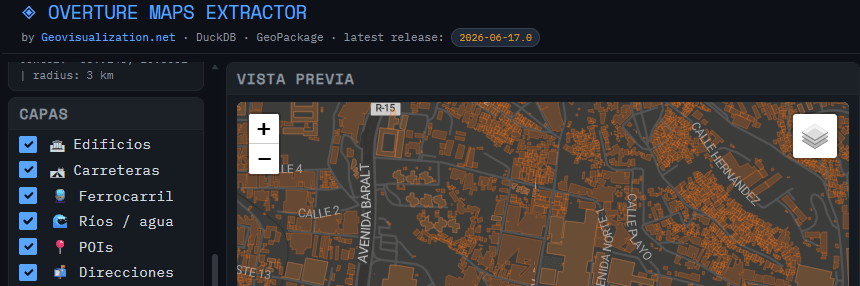
Just wanted to update on the usage of the tool I developed (OVERTURE MAPS EXTRACTOR) for extraction of Open data from Overture Maps for a quick hands on.
SolarScope: cuando el catastro, el LiDAR y el sol se sientan a la misma mesa
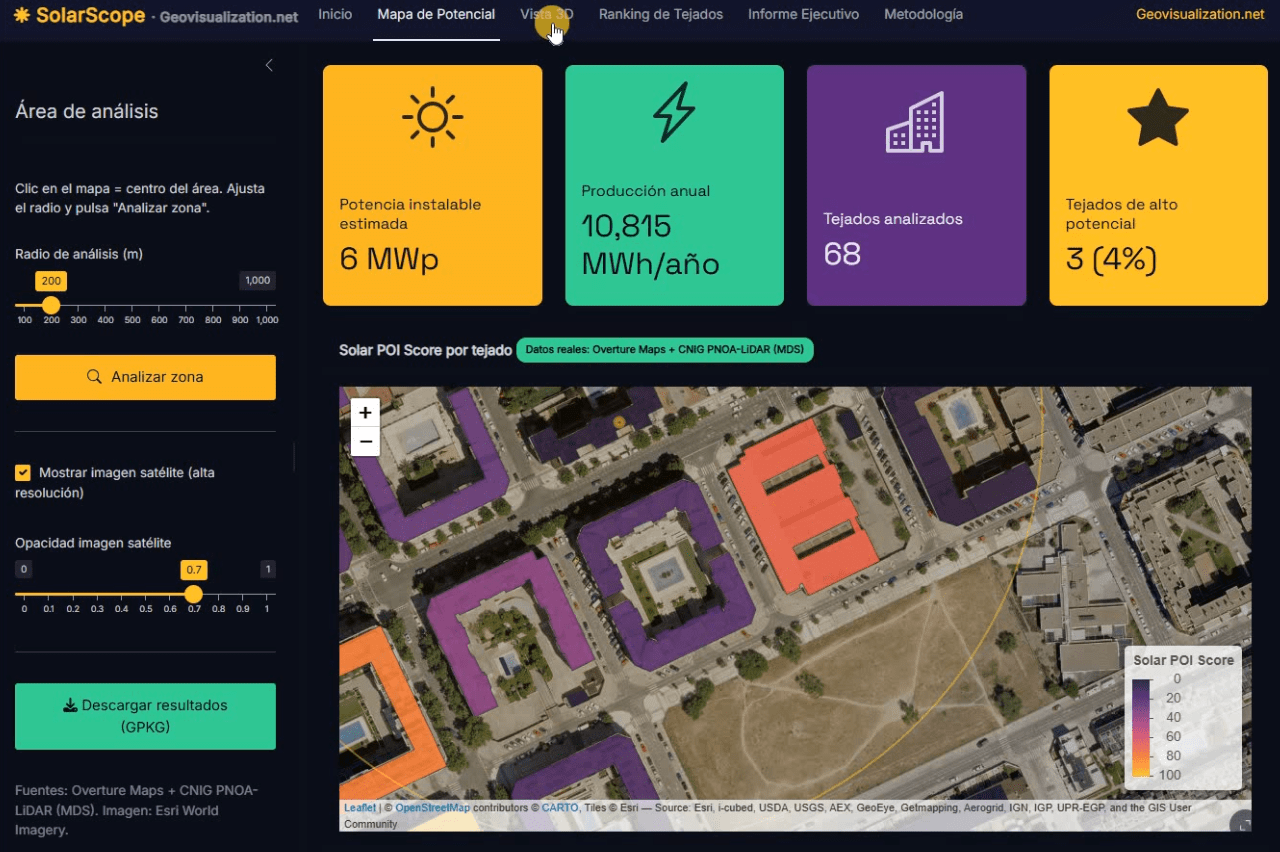
Llevo unos días dándole vueltas a una idea que, en el fondo, es bastante sencilla: si tenemos la huella de cada edificio, su altura y un modelo digital de superficies de alta resolución, ¿por qué seguimos viendo estudios de potencial solar que tratan los tejados como manchas homogéneas sobre un mapa? De esa pregunta, y de unas cuantas sesiones intensas de R, ha salido SolarScope, una aplicación Shiny que estoy desarrollando para hacer scoring de potencial fotovoltaico tejado a tejado, con datos abiertos y un flujo que se puede reproducir tanto en España como en Estados Unidos.
POI Intelligence for Urban Asset Analysis in RStudio: assetIQ
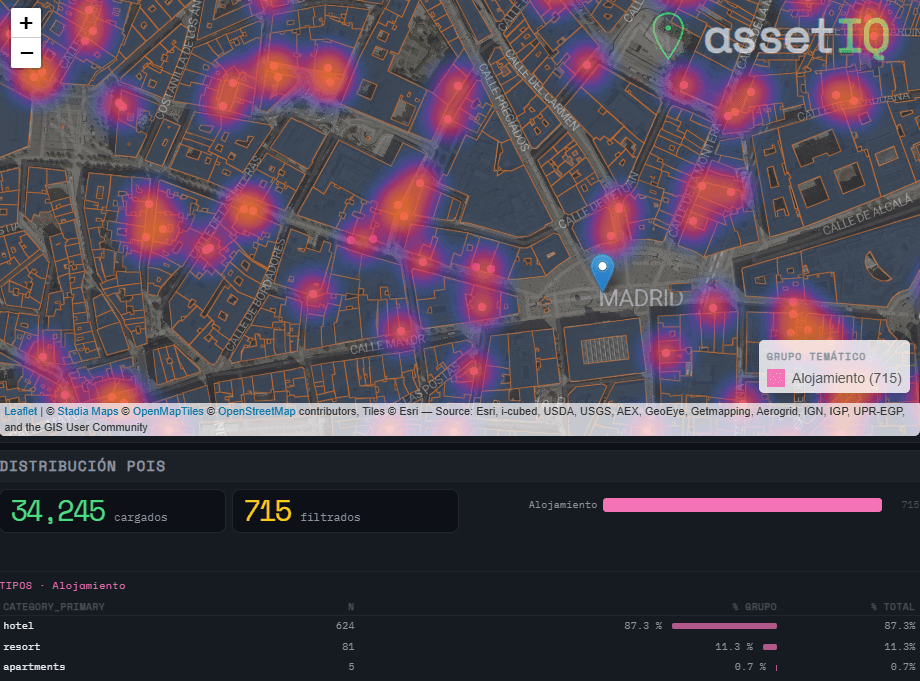
When analysing urban assets, there is genuine value in moving beyond generic neighborhood scores. The density of a coffee shop cluster, the proximity to a financial hub, or the concentration of accommodation around a transport node are signals that traditional datasets flatten into averages — or ignore entirely. assetIQ was built to change that. assetIQ is an R application powered by DuckDB and Overture Maps that extracts, classifies, and scores Points of Interest (POIs) for any location on Earth. You define a city and a search radius — from 100 meters to 25 kilometers — and the tool queries the Overture Maps Places dataset in real time, classifying each POI into thematic groups: Food & Drink, Retail, Health, Education, Transport, Accommodation, Financial Services, Leisure & Culture, Sport, and more.
The core output is an attribute value called POIQ: a normalized 0–1 score assigned to every building footprint within the area of interest, derived from a Kernel Density Estimation of the selected thematic group. A building in a dense retail corridor scores close to 1. An isolated residential block far from any commerce scores close to 0. This transforms thousands of individual points — which in raw form tell you very little — into a single, interpretable attribute per building, ready for downstream modelling, valuation, or site selection.

