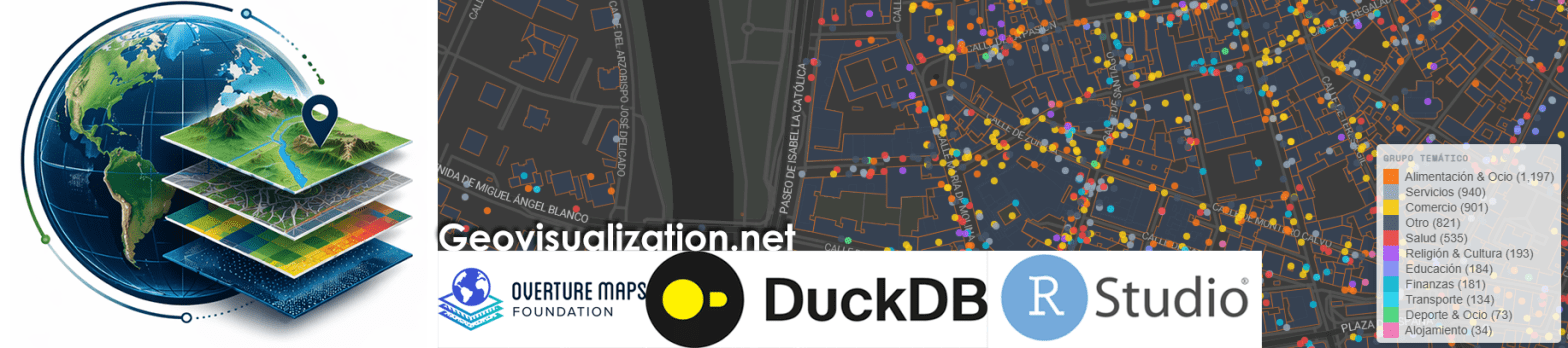
El análisis de la distribución espacial de servicios financieros en centros urbanos —bancos, cajeros, aseguradoras, gestorías y corredurías de seguros— ofrece una lectura directa de la vitalidad económica y la accesibilidad financiera de un territorio. Mapear estos puntos con assetIQ sobre datos Overture Maps permite identificar en minutos dónde se concentra la actividad financiera, qué zonas quedan en la periferia del servicio y cómo se estructuran los ejes comerciales de cada ciudad. El mismo análisis es replicable para cualquier otra capa temática —alojamiento, salud, restauración, deporte— convirtiendo cada capital de provincia en un dashboard geoespacial comparable y reproducible.
Category Archives: gis analysis
El kernel que sigue al fuego: reconstruyendo el pulso de un fuego con datos satelitales
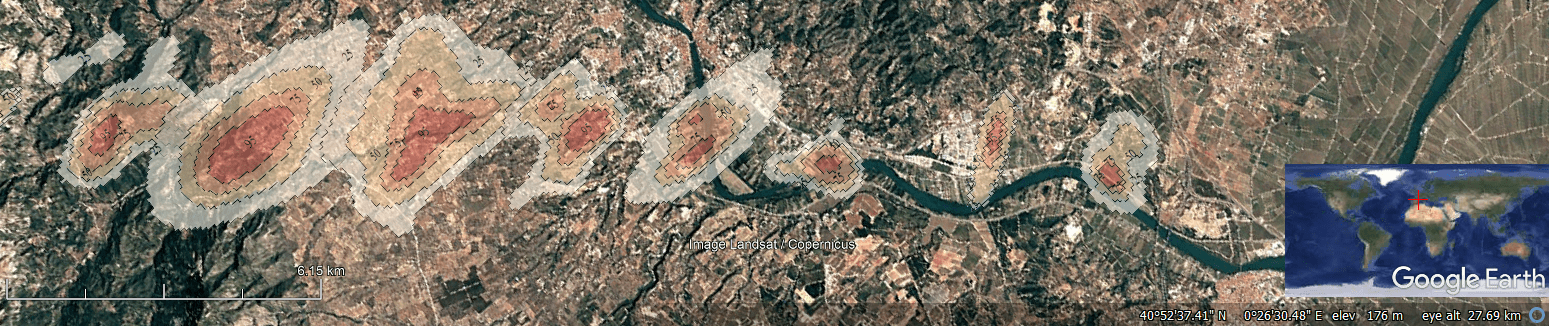
He pasado los últimos días construyendo Fire Kernel Tracker, una app en R Shiny que representa el ciclo de vida completo de un incendio forestal: desde el primer foco hasta la extinción, usando un kernel de densidad espacio-temporal ponderado por FRP (Fire Radiative Power) sobre detecciones satelitales VIIRS/MODIS de NASA FIRMS.
Super-resolution 1m vs ‘Google Maps de Incendios Forestales’ en Guadalajara, España 20260723
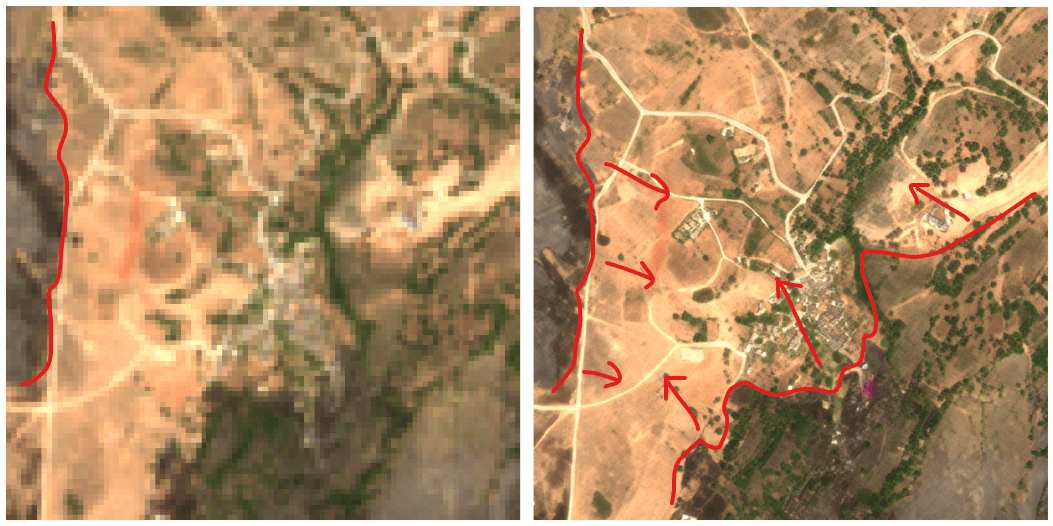
Parece que ya estamos llegando al final de este incendio pero se ha “comido” casi 32,000 ha! y me llamó la atención cómo lo tienen que haber pasado los habitantes de este pequeño pueblo de la zona llamado Las Navas de Jadraque que según Google Maps, se quemó enteramente… el fuego de la Sierra Norte de Guadalajara es exactamente ese tipo de incendio “mega” (más de 30.000 ha, nivel 2, decenas de pueblos evacuados) donde la cobertura mediática y las capas de datos rápidos tienden a generalizar y “tragarse” núcleos de población que en realidad sobrevivieron, sobre todo cuando hay defensa activa in situ.
De NDVI a CO2e: un pipeline MRV de estimación de emisiones FLAG con GEE
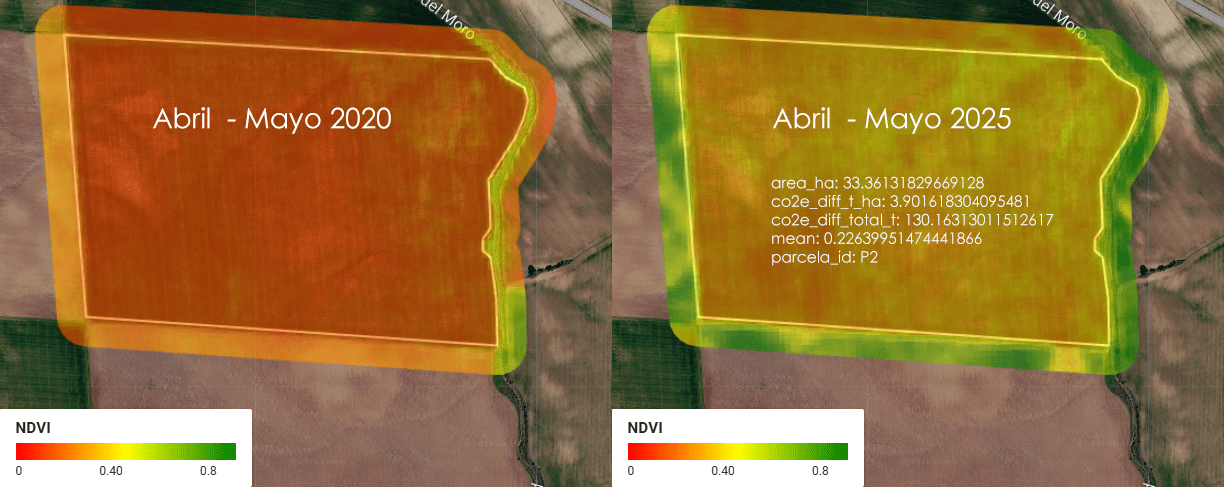
Imagina una empresa que se llama ACME. ACME es dueña de 5 parcelas de tierra en Almendralejo, Extremadura, España, donde se cultiva cereal (trigo, cebada, ese tipo de cosas). Entre las 5 parcelas, ACME tiene un total de 1.52 km² de tierra — para que te hagas una idea, eso es más o menos el tamaño de 300 campos de fútbol (a rzón de aproximadamente media hectárea por cada campo).
VENEZUELA EARTHQUAKE RESPONSE using DuckDB, Overture Maps and R
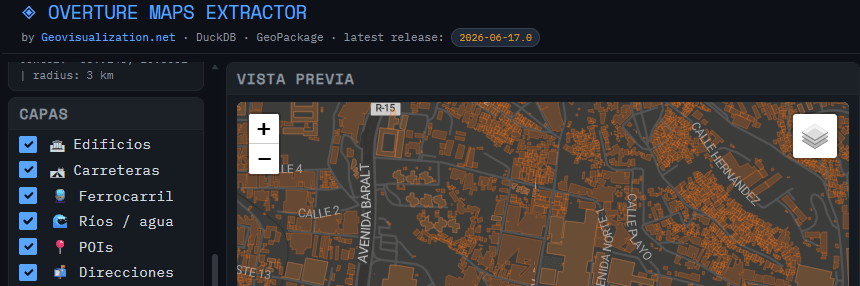
Just wanted to update on the usage of the tool I developed (OVERTURE MAPS EXTRACTOR) for extraction of Open data from Overture Maps for a quick hands on.
Bingham Canyon: El deslizamiento más grande de la historia minera moderna analizado con radar SENTINEL-1
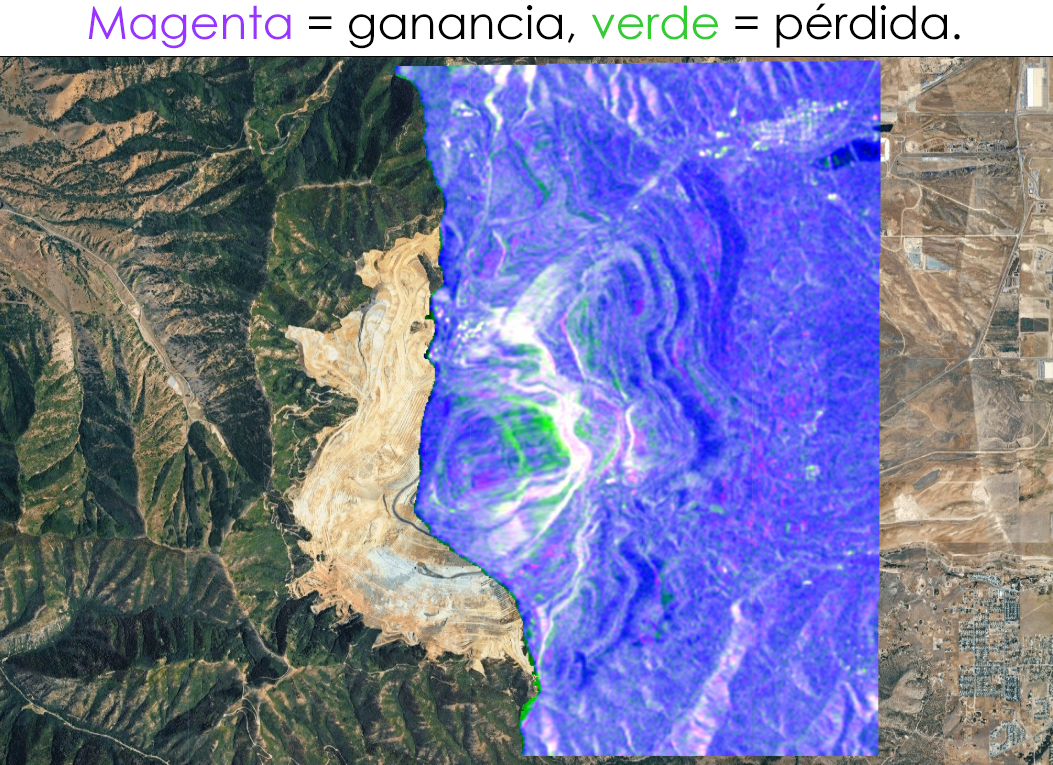
Análisis de cambios con SAR (Radar de Apertura Sintética) usando Sentinel-1 sobre la mina Bingham Canyon en Utah, donde ocurrió uno de los mayores deslizamientos de tierra de la historia minera el 10 de abril de 2013.
SolarScope: cuando el catastro, el LiDAR y el sol se sientan a la misma mesa
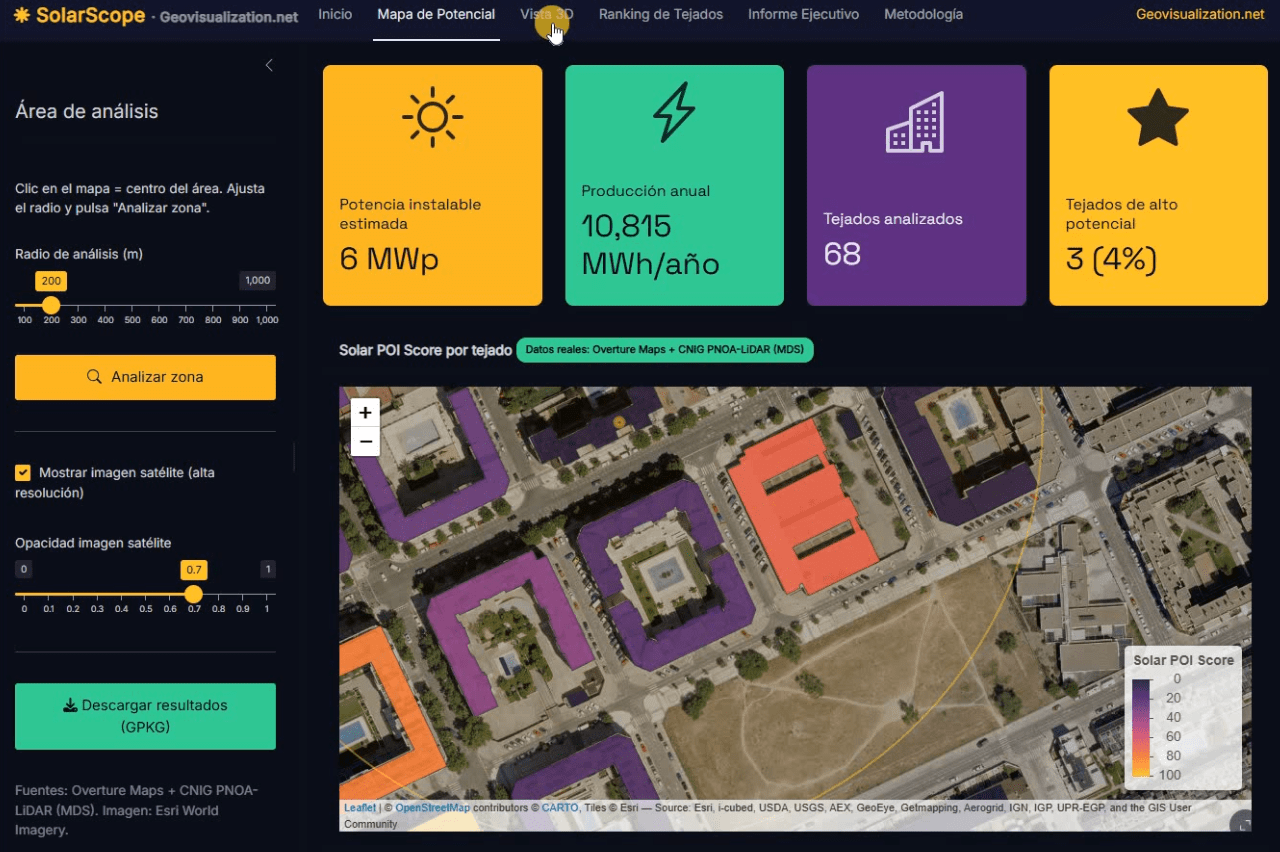
Llevo unos días dándole vueltas a una idea que, en el fondo, es bastante sencilla: si tenemos la huella de cada edificio, su altura y un modelo digital de superficies de alta resolución, ¿por qué seguimos viendo estudios de potencial solar que tratan los tejados como manchas homogéneas sobre un mapa? De esa pregunta, y de unas cuantas sesiones intensas de R, ha salido SolarScope, una aplicación Shiny que estoy desarrollando para hacer scoring de potencial fotovoltaico tejado a tejado, con datos abiertos y un flujo que se puede reproducir tanto en España como en Estados Unidos.
Time Series Analyzer: Análisis multitemporal de índices espectrales en Google Earth Engine
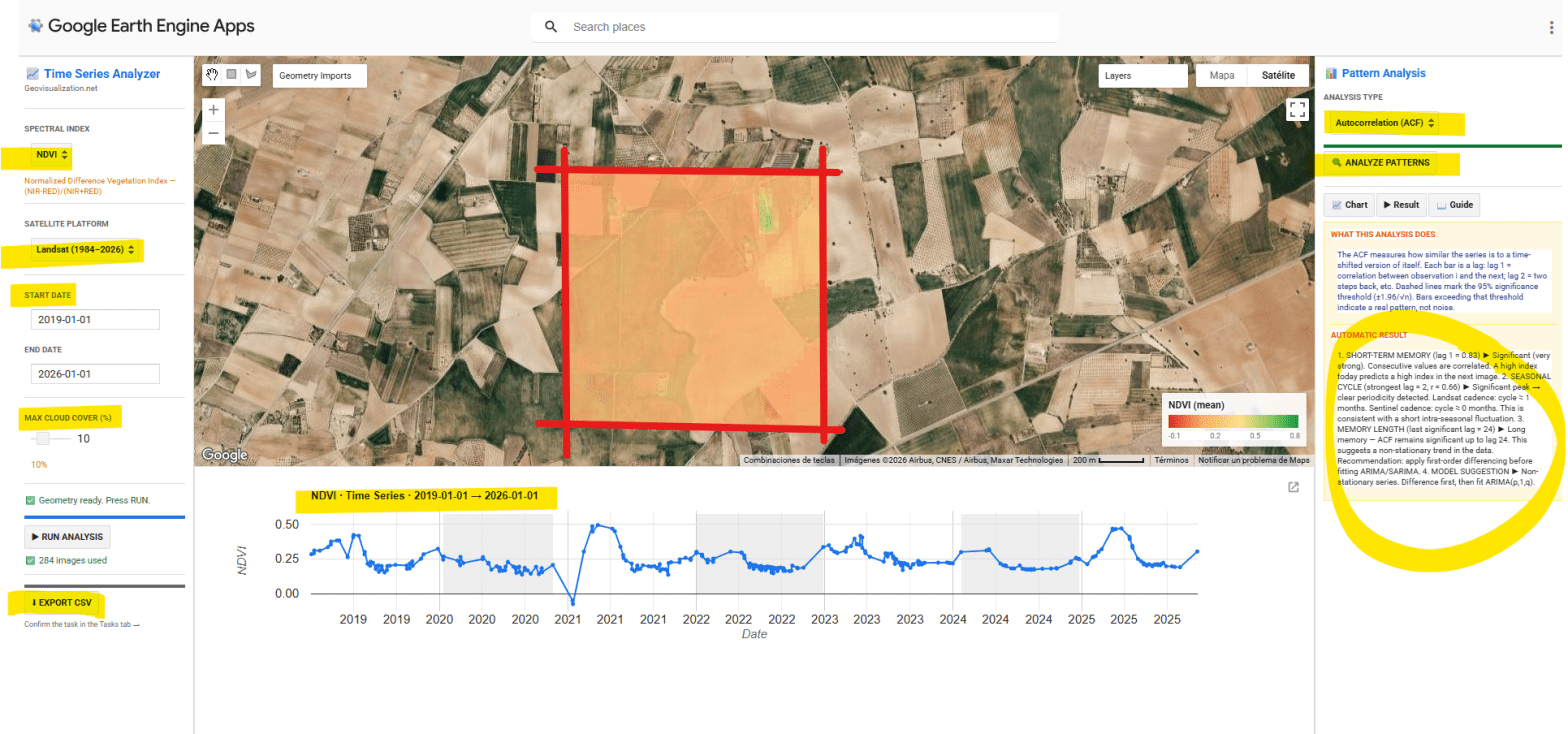
He desarrollado una aplicación interactiva en Google Earth Engine para la extracción y análisis estadístico automático de series temporales de cinco índices espectrales (NDVI, EVI, SAVI, NDWI y NBR) sobre cualquier geometría definida por el usuario en cualquier sitio del mundo. El objetivo es pasar de una imagen satélite puntual a una comprensión temporal del territorio: qué ha pasado, qué patrón subyace, y qué cabe esperar.
POI Intelligence for Urban Asset Analysis in RStudio: assetIQ
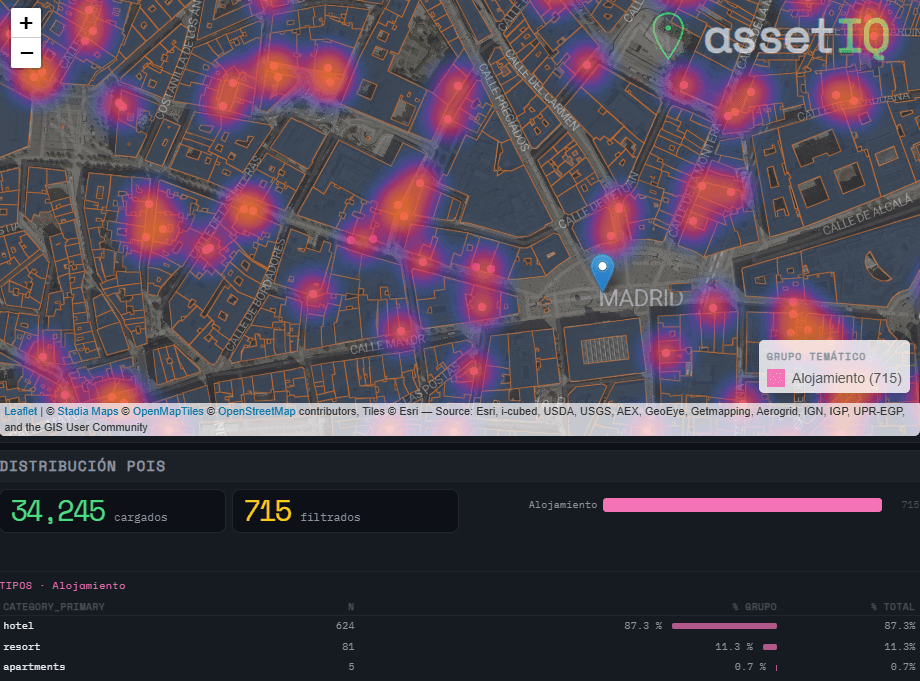
When analysing urban assets, there is genuine value in moving beyond generic neighborhood scores. The density of a coffee shop cluster, the proximity to a financial hub, or the concentration of accommodation around a transport node are signals that traditional datasets flatten into averages — or ignore entirely. assetIQ was built to change that. assetIQ is an R application powered by DuckDB and Overture Maps that extracts, classifies, and scores Points of Interest (POIs) for any location on Earth. You define a city and a search radius — from 100 meters to 25 kilometers — and the tool queries the Overture Maps Places dataset in real time, classifying each POI into thematic groups: Food & Drink, Retail, Health, Education, Transport, Accommodation, Financial Services, Leisure & Culture, Sport, and more.
The core output is an attribute value called POIQ: a normalized 0–1 score assigned to every building footprint within the area of interest, derived from a Kernel Density Estimation of the selected thematic group. A building in a dense retail corridor scores close to 1. An isolated residential block far from any commerce scores close to 0. This transforms thousands of individual points — which in raw form tell you very little — into a single, interpretable attribute per building, ready for downstream modelling, valuation, or site selection.
Mapterhorn + R: LOS analysis in seconds! 🚀

The analysis of LOS (Line of Sight) in telecommunications is the study that determines whether a clear, unobstructed path exists between a transmitting antenna and a receiver. While this calculation was traditionally reserved for large microwave links over long distances or in rural environments, the arrival of 5G networks and the horizon of 6G have turned it into an absolute priority for urban deployment, completely transforming how networks are planned in major cities.
