POI Intelligence for Urban Asset Analysis in RStudio: assetIQ

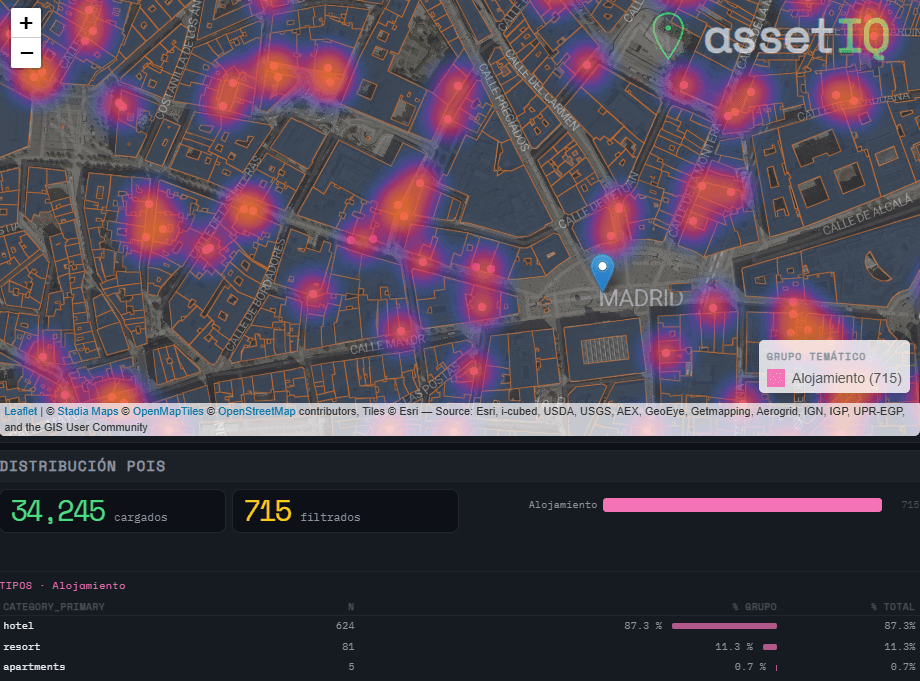
When analysing urban assets, there is genuine value in moving beyond generic neighborhood scores. The density of a coffee shop cluster, the proximity to a financial hub, or the concentration of accommodation around a transport node are signals that traditional datasets flatten into averages — or ignore entirely. assetIQ was built to change that. assetIQ is an R application powered by DuckDB and Overture Maps that extracts, classifies, and scores Points of Interest (POIs) for any location on Earth. You define a city and a search radius — from 100 meters to 25 kilometers — and the tool queries the Overture Maps Places dataset in real time, classifying each POI into thematic groups: Food & Drink, Retail, Health, Education, Transport, Accommodation, Financial Services, Leisure & Culture, Sport, and more.

The core output is an attribute value called POIQ: a normalized 0–1 score assigned to every building footprint within the area of interest, derived from a Kernel Density Estimation of the selected thematic group. A building in a dense retail corridor scores close to 1. An isolated residential block far from any commerce scores close to 0. This transforms thousands of individual points — which in raw form tell you very little — into a single, interpretable attribute per building, ready for downstream modelling, valuation, or site selection.

Detecting Potential Mobile Coverage Gaps Using OpenCellID, GHSL and Overture Maps: Case study over TUNIS

Mobile connectivity has become a fundamental component of modern infrastructure, yet significant spatial inequalities in network access still persist across both urban peripheries and rural environments. Using openly available geospatial datasets, this analysis explores potential mobile coverage gaps by combining OpenCellID cellular infrastructure observations, GHSL population layers and vector data extracted from Overture Maps. The objective is not to reproduce real telecom propagation models, but to generate a simplified spatial estimation of coverage capable of identifying populated areas potentially located outside the influence of nearby cellular infrastructure.

From Overture Maps to GPKG in minutes: Building a Geospatial Data Extractor with R and DuckDB

Modern geospatial workflows increasingly depend on fast, reliable access to city-scale vector data — building footprints, road networks, land use polygons, points of interest, address databases. Whether you are designing a 5G radio network, modelling urban heat islands, planning last-mile logistics, or simulating emergency response coverage, you almost always start from the same question: “How do I get clean, structured geodata for this city, right now, without spending two days on it?”

The Overture Maps Extractor is my answer to that question. It is a Shiny application written in R that lets any GIS professional extract multiple thematic layers from the Overture Maps Foundation dataset — for any city in the world — in a matter of minutes, with zero command-line interaction and zero manual data wrangling.

From LIDAR USGS to DSM in a few lines of code. The magic of R

The USGS LiDAR Explorer, hosted via gishub.org, serves as a high-performance web gateway for interacting with the USGS 3D Elevation Program (3DEP) datasets. First thing, go to this GITHUB repository https://github.com/opengeos/maplibre-gl-usgs-lidar, download code for the project (code>download ZIP), get connected with RStudio, save new project and open a script window… It’s all set up!

¡Con R de running!

Un registro constante: más de 11 años (desde Agosto 2014 hasta hoy) con más de 1,150 sesiones documentadas. Un proyecto vital; no son solo números, es la cronología de mi disciplina. Puedo decir de nuevo que R me ha roto mis esquemas de geógrafo de ArcGIS, de Global Mapper y QGIS, ahora no todo pasa por el filtro de tener coordenadas, por ejemplo estos insights no tienen coordenadas pero son analizables y se pueden tomar conclusiones que te permiten tomar decisiones rápidas… Echemos un vistazo a mis carreras los últimos años.

R analysis for HR corporate talent management

I am a geographer by training, and my professional career has always had a predominantly geospatial focus. Having recently completed a forty-hour course in R, using RStudio and GitHub, I feel that a whole new world of analysis has opened up before me. This work represents the meeting point between my basic geographical instinct and the technical capabilities of statistical programming. It is important to emphasise that I have invented this data and model entirely, so the results have no real meaning and contain inevitable biases. Their sole purpose is to learn and demonstrate the capabilities of this language. I believe that geographical knowledge and code are interdependent, as one without the other would not function successfully. It is precisely this symbiosis that I hope will make a difference in my current job search.