
Este agosto, España y Portugal han vivido una temporada de incendios excepcionalmente dura. En España, las llamas han calcinado ~382.000 hectáreas (más de seis veces la media reciente) y han dejado víctimas mortales; en Portugal, las superficies quemadas superan las 200.000 hectáreas, muy por encima del promedio 2006–2024 para estas fechas. El humo cruzó fronteras y degradó la calidad del aire a cientos de kilómetros.
Tag Archives: Spain
Running in Madrid. A GIS approach!

these density maps performed in Global Mapper overlay the geometry lines saved out my running application (Garmin Connect). and once they are exported to points, i can generate a density map, chosing an easy to understand legend and i overlay to Google Earth so its also easy to be sent if needed be (why for? i don’t know!).
Descargas del CNIG. Open Source bien hecho!

Hola amigos del GIS, Por motivos de trabajo que no vienen al caso, he tenido que bucear de manera sistemática la web de descargas del CNIG. http://centrodedescargas.cnig.es/CentroDescargas/inicio.do Una maravilla. Por motivos que tampoco viene al caso, he de hacer esto mismo de vez en cuando en todos los Institutos cartográficos del mundo y el delContinue reading “Descargas del CNIG. Open Source bien hecho!”
Jugando con CartoDB

Hace ya mucho tiempo que he oído hablar de CartoDB y que vengo practicando en su página web a visualizar bases de datos sencillas. Crea una cuenta Incorpora tus datos o tómalos de la galería Selecciona en modo datos la columna que quieres simbolizar/visualizar Conviértela en NUMBER si estuviera en STRING Selecciona en modo mapaContinue reading “Jugando con CartoDB”
Tipologías usuarios Madrid Río. Estadísticas y tendencias interesantes
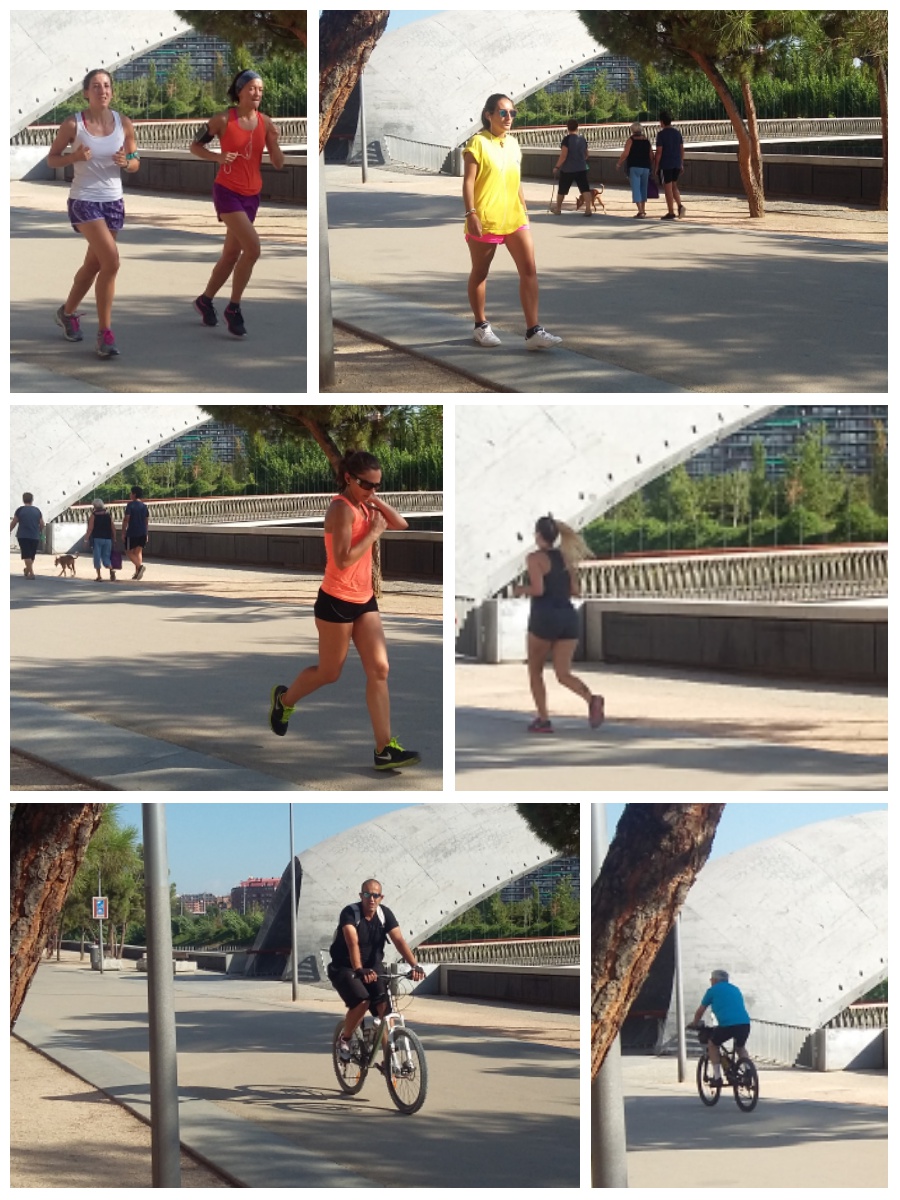
Para la multitud de personas a las que como a mí, les ha sorprendido esta infrastructura en frente de sus casas hay posibilidad de encontrarse en el mismo metro cuadrado a alguien corriendo, alguien andando, una pareja con un carrito de niños, unos amigos en patines, alguna persona en bici… unos más rápido y unos más lento, todos hemos de convivir en un trazado de unos 7,5km de largo y no más unos metros de ancho, con lo que unas mínimas normas de circulación se imponen.
Comparing France Meteo and Spain Meteo from the visualization point of view
After living in France for four years i have to tell i am always aware of Meteo information on TV (well, i live in Brittany, i guess this makes sense!). It was the same in Spain or anywhere else in the world where i had lived and the reason why is i have always lovedContinue reading “Comparing France Meteo and Spain Meteo from the visualization point of view”
Remote Sensing, Photogrammetry, Lidar and Landuse IGN Spain
A few more lines for leting you know again that i passed this other course just now in Instituto Geográfico of Spain (IGN). Remote Sensing, Photogrammetry, Lidar and Landuse, a comprehensive 40h update on relevant information i need tu use on a daily basis. This ‘update’ helps me to better understand what i am working with andContinue reading “Remote Sensing, Photogrammetry, Lidar and Landuse IGN Spain”
PISA report SPAIN 2012 by Comunidades Autónomas Trends North-South and West-East
I wanted to take advantage of the latest ‘advanced course on Statistical Analysis’ followed in the spanish IGN and show you how North-South and West-East trends impact on this report. As you can see, the higher the values, the most likely to be in the North and the East of the country. This doesn’t meanContinue reading “PISA report SPAIN 2012 by Comunidades Autónomas Trends North-South and West-East”
One more 3D building in Avenida de la Vega. Restaurante Asiático SHENG. Madrid, Spain.
I used to have lunch every thrusday there, at the ‘Restaurante Asiático SHENG’. I strongly recommend you ‘entremeses’ (In China you will find them as ‘dim-sum’) and Cantonese duck or Hong Kong duck (this was slightly spicy thou). Very good food, very fast service and pretty cheap menu: 10,7 €… ideal for an IT worker!. TheseContinue reading “One more 3D building in Avenida de la Vega. Restaurante Asiático SHENG. Madrid, Spain.”
Vicalvaro Buildings 3D. Madrid, Spain.
And Now I would like to add one more set of buildings around my house. This is a block of flats in Vicálvaro, Madrid, Spain. This is supposed to be ‘Valderribas’ area… hope you like them!
