I wanted to take advantage of the latest ‘advanced course on Statistical Analysis’ followed in the spanish IGN and show you how North-South and West-East trends impact on this report.
As you can see, the higher the values, the most likely to be in the North and the East of the country. This doesn’t mean we are not going to find high values in other CCAA, but this is the result of the trend.
What’s a Comunidad Autónoma? (the administrative level used for this report), You can read it here.
Let say for instance we want to focus on Reading Literacy. The highest values trend on being over the Northern and Eastern Comunidades Autonomas: Navarra, but we also find high values over La Rioja, Asturias, Euskadi or Aragón (they’re all in the North).

The blue line shows how figures are increasing if we move to the North, likewise, if we look at the green line, higher values are in the eastern side of the Map.
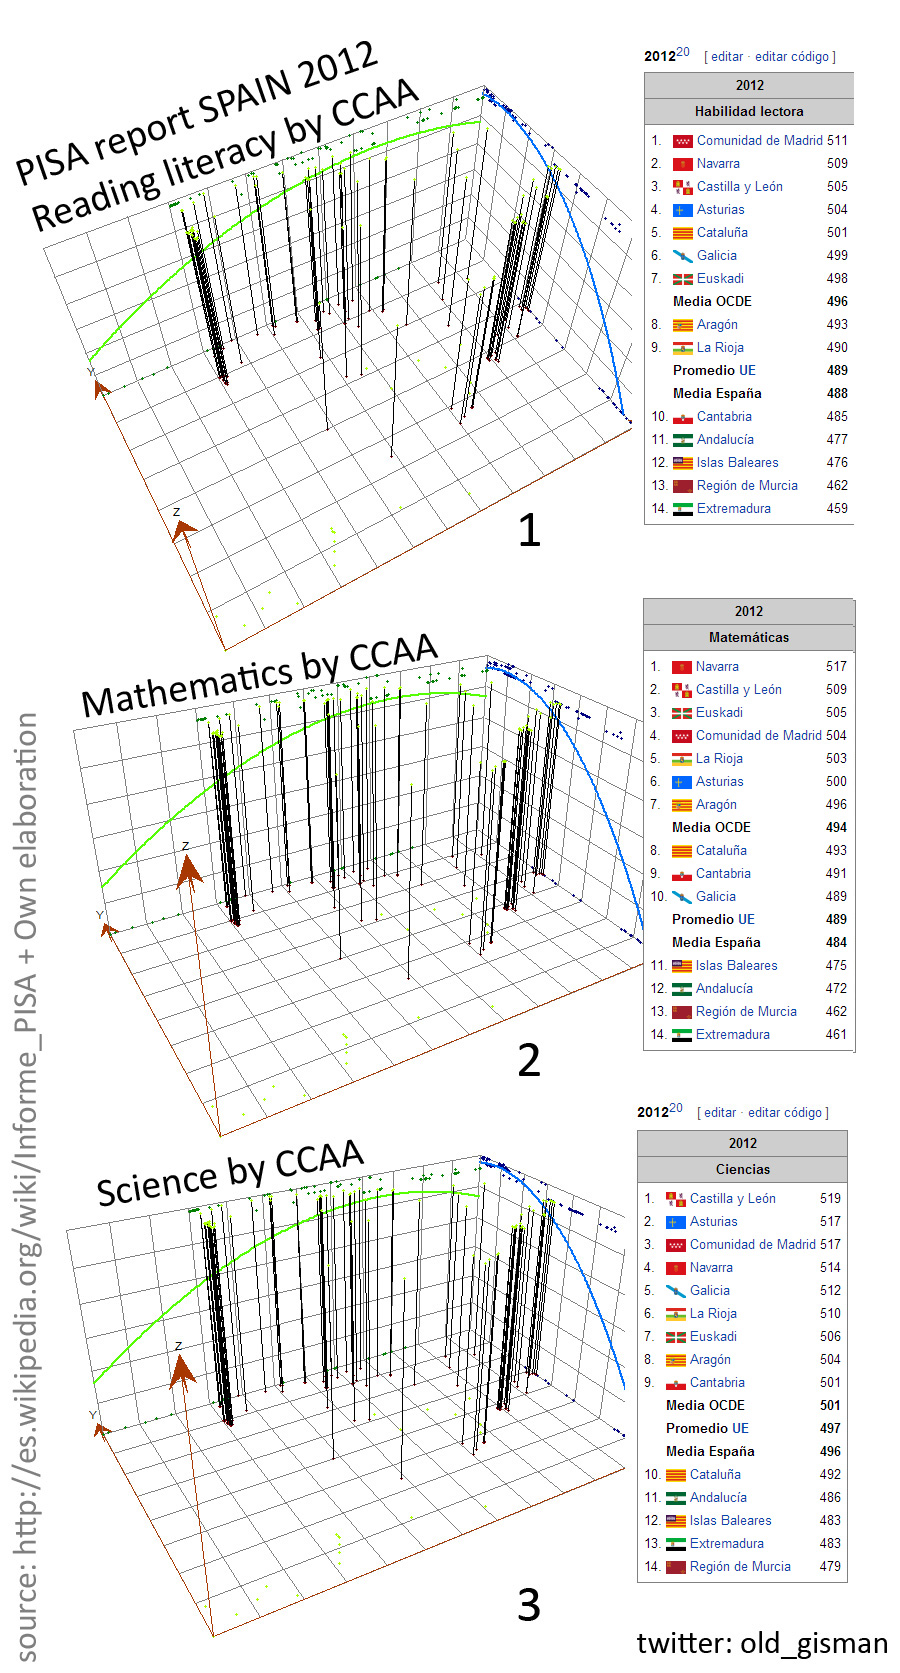
Also note how the lowest values fall over the Comunidades Autónomas located in the South and the West of Spain (I.e Andalucía and Extremadura).
It’s also important highlighting there are some outliers or regions with low values in the West (Murcia) or in the North but this is all about Trends!!! : -)
Source: WIKIPEDIA (http://es.wikipedia.org/wiki/Informe_PISA) and own elaboration
Software used: ArcGIS 10.0 /Geostatistical Analyst extension
20131220

I hope you guys find it interesting, please dont hesitate to ask if i can explain you any further.
Thank you for your time,
Alberto C.
MSc GIS
