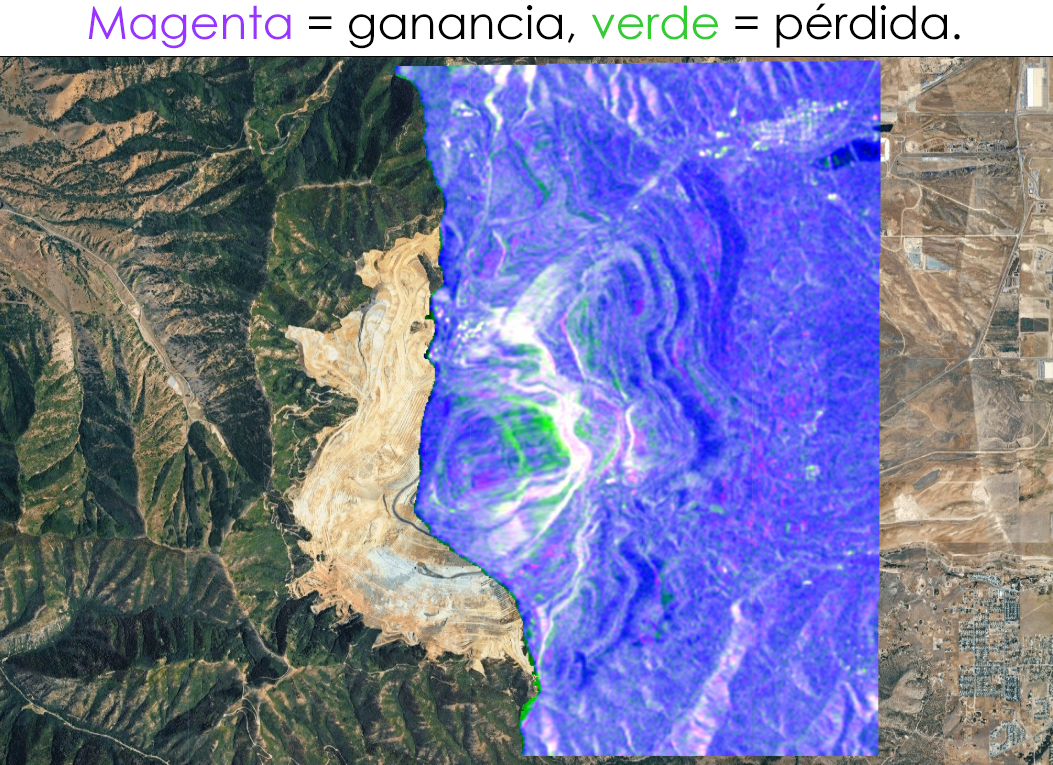
Análisis de cambios con SAR (Radar de Apertura Sintética) usando Sentinel-1 sobre la mina Bingham Canyon en Utah, donde ocurrió uno de los mayores deslizamientos de tierra de la historia minera el 10 de abril de 2013.
Tag Archives: geography
SolarScope: cuando el catastro, el LiDAR y el sol se sientan a la misma mesa
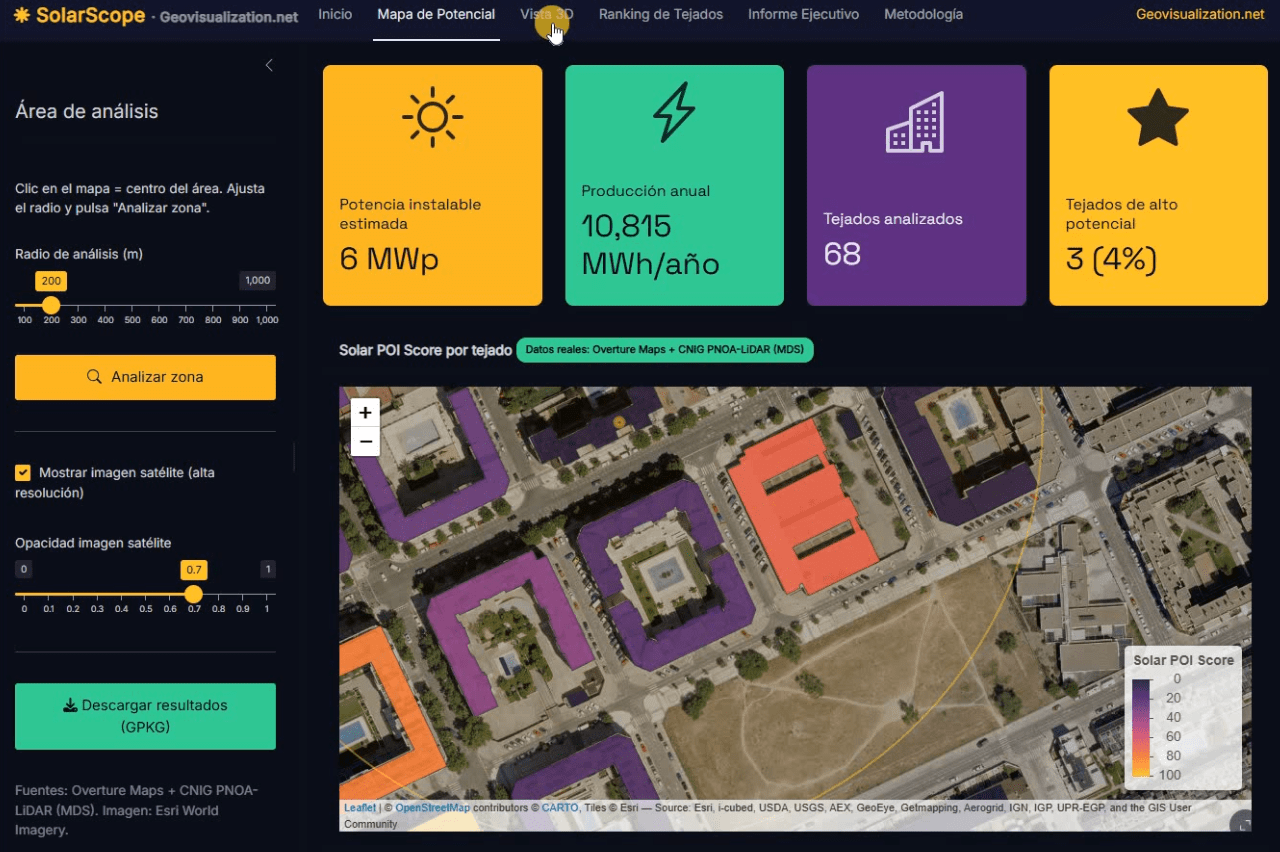
Llevo unos días dándole vueltas a una idea que, en el fondo, es bastante sencilla: si tenemos la huella de cada edificio, su altura y un modelo digital de superficies de alta resolución, ¿por qué seguimos viendo estudios de potencial solar que tratan los tejados como manchas homogéneas sobre un mapa? De esa pregunta, y de unas cuantas sesiones intensas de R, ha salido SolarScope, una aplicación Shiny que estoy desarrollando para hacer scoring de potencial fotovoltaico tejado a tejado, con datos abiertos y un flujo que se puede reproducir tanto en España como en Estados Unidos.
Time Series Analyzer: Análisis multitemporal de índices espectrales en Google Earth Engine
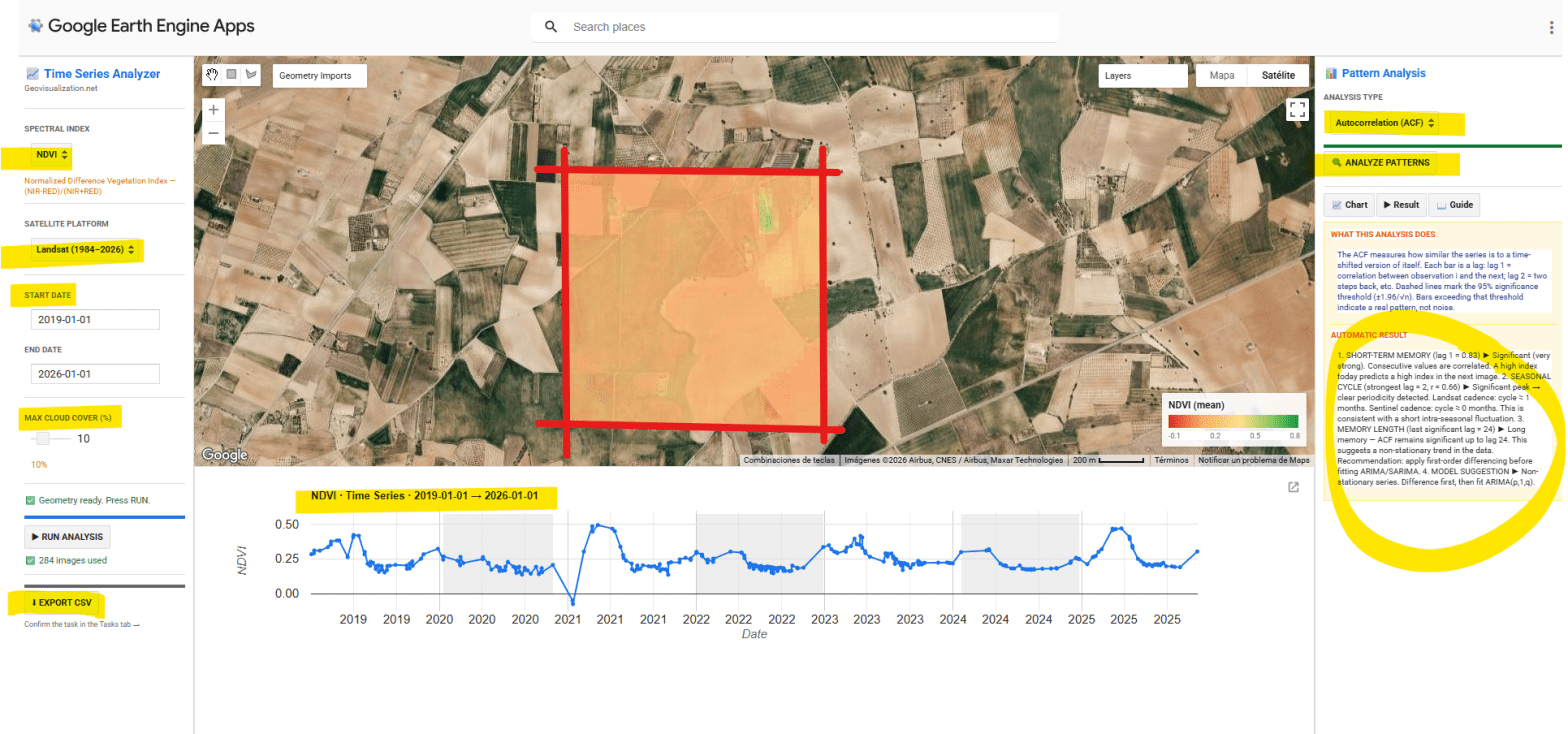
He desarrollado una aplicación interactiva en Google Earth Engine para la extracción y análisis estadístico automático de series temporales de cinco índices espectrales (NDVI, EVI, SAVI, NDWI y NBR) sobre cualquier geometría definida por el usuario en cualquier sitio del mundo. El objetivo es pasar de una imagen satélite puntual a una comprensión temporal del territorio: qué ha pasado, qué patrón subyace, y qué cabe esperar.
POI Intelligence for Urban Asset Analysis in RStudio: assetIQ
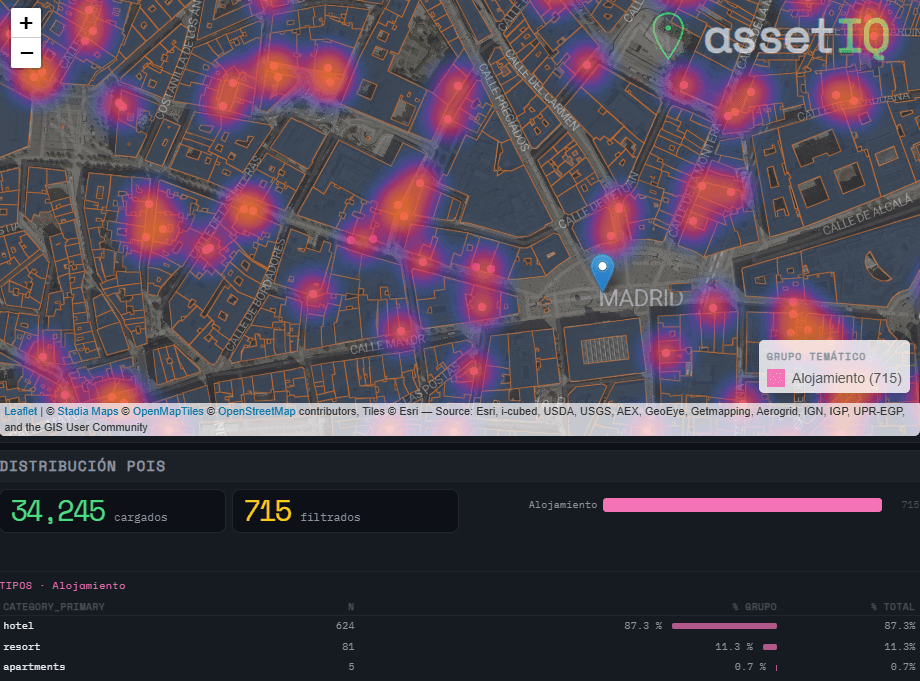
When analysing urban assets, there is genuine value in moving beyond generic neighborhood scores. The density of a coffee shop cluster, the proximity to a financial hub, or the concentration of accommodation around a transport node are signals that traditional datasets flatten into averages — or ignore entirely. assetIQ was built to change that. assetIQ is an R application powered by DuckDB and Overture Maps that extracts, classifies, and scores Points of Interest (POIs) for any location on Earth. You define a city and a search radius — from 100 meters to 25 kilometers — and the tool queries the Overture Maps Places dataset in real time, classifying each POI into thematic groups: Food & Drink, Retail, Health, Education, Transport, Accommodation, Financial Services, Leisure & Culture, Sport, and more.
The core output is an attribute value called POIQ: a normalized 0–1 score assigned to every building footprint within the area of interest, derived from a Kernel Density Estimation of the selected thematic group. A building in a dense retail corridor scores close to 1. An isolated residential block far from any commerce scores close to 0. This transforms thousands of individual points — which in raw form tell you very little — into a single, interpretable attribute per building, ready for downstream modelling, valuation, or site selection.
Mapterhorn + R: LOS analysis in seconds! 🚀

The analysis of LOS (Line of Sight) in telecommunications is the study that determines whether a clear, unobstructed path exists between a transmitting antenna and a receiver. While this calculation was traditionally reserved for large microwave links over long distances or in rural environments, the arrival of 5G networks and the horizon of 6G have turned it into an absolute priority for urban deployment, completely transforming how networks are planned in major cities.
Detecting Potential Mobile Coverage Gaps Using OpenCellID, GHSL and Overture Maps: Case study over TUNIS
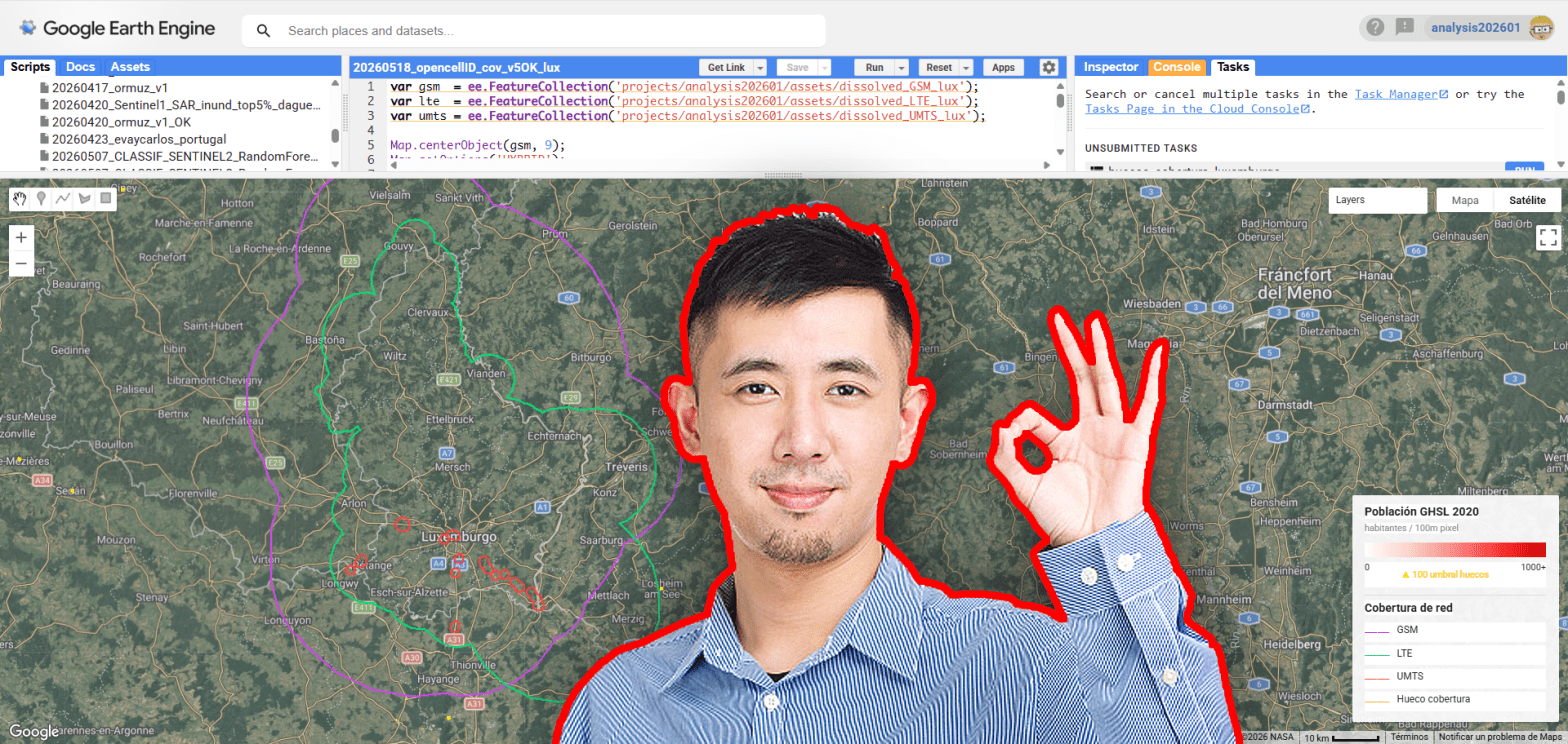
Mobile connectivity has become a fundamental component of modern infrastructure, yet significant spatial inequalities in network access still persist across both urban peripheries and rural environments. Using openly available geospatial datasets, this analysis explores potential mobile coverage gaps by combining OpenCellID cellular infrastructure observations, GHSL population layers and vector data extracted from Overture Maps. The objective is not to reproduce real telecom propagation models, but to generate a simplified spatial estimation of coverage capable of identifying populated areas potentially located outside the influence of nearby cellular infrastructure.
CHANGE DETECTION ARCGIS PRO AND LIVING ATLAS 2017-2025
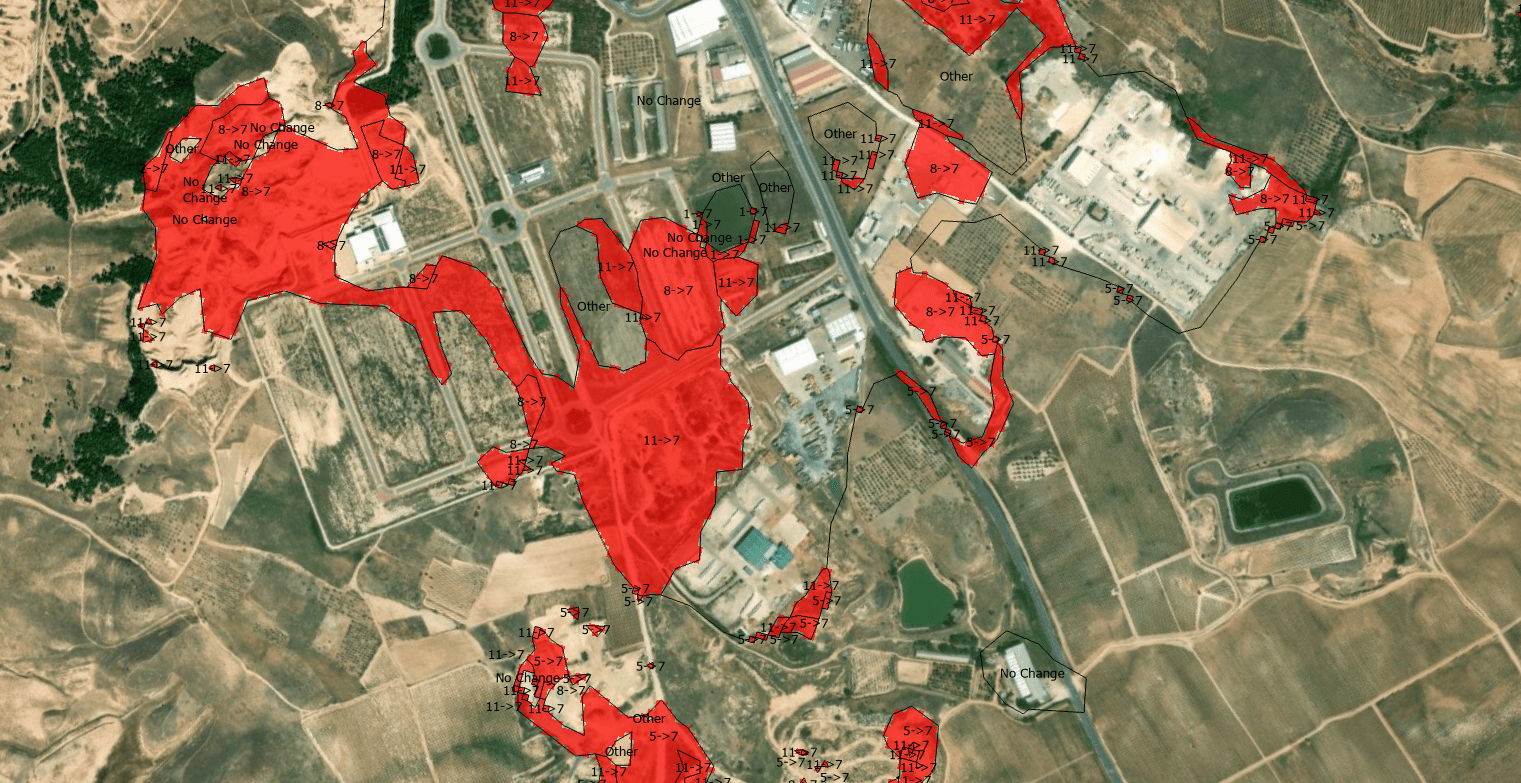
The quantification of land-use dynamics necessitates a spatiotemporal framework that ensures categorical stability over long-term observation windows. The ESRI 10-Meter Global Land Cover time series, accessible through the ArcGIS Living Atlas, provides a harmonized baseline for this purpose, derived from the dense temporal stack of the ESA Sentinel-2 mission.
Who Gets to See the War? Satellite Imagery Censorship and the Copernicus Alternative
A private company, operating under a US federal license, was effectively told by the Trump administration to go dark over an active war zone. Planet complied. Vantor and BlackSky — both heavily dependent on US defense revenue — said they hadn’t even received such a request, because they were already tightly controlling access. The selective pressure lands precisely on the most open, most commercially accessible provider. That is not a coincidence.A private company, operating under a US federal license, was effectively told by the Trump administration to go dark over an active war zone. Planet complied. Vantor and BlackSky — both heavily dependent on US defense revenue — said they hadn’t even received such a request, because they were already tightly controlling access. The selective pressure lands precisely on the most open, most commercially accessible provider. That is not a coincidence.
1762 followers in LinkedIn is something (updated 20260615)
Una red con nombre y apellidos. A veces, las métricas de las redes sociales nos hacen olvidar que detrás de cada clic hay una persona. Ver este camino de 1531 profesionales a vista de helicóptero no es un ejercicio de ego, sino de gratitud.
AERIAL SURVEYOR SIMULATOR: Reimagining Aerial Photography

For three years, my office was thousands of feet in the air. As an aerial photographer, I spent my days capturing the world’s textures, layouts, and topographies from a cockpit—a masterclass in perspective that I am now transforming into a Aerial Surveyor Simulator.
