Imagina una empresa que se llama ACME. ACME es dueña de 5 parcelas de tierra en Almendralejo, Extremadura, España, donde se cultiva cereal (trigo, cebada, ese tipo de cosas). Entre las 5 parcelas, ACME tiene un total de 1.52 km² de tierra — para que te hagas una idea, eso es más o menos el tamaño de 300 campos de fútbol (a rzón de aproximadamente media hectárea por cada campo).
Category Archives: statistique
KALMAN RADAR TRACKER: SEGUIMIENTO DE BLANCOS AÉREOS
Cuando alguien me pregunta sobre radar, pienso sobre todo en radares montados en satélites (sesgo geospacial) pero en realidad hay mucho más, hoy voy a hablaros de de radares aeroportados, de filtros de Kalman y seguimiento de blancos aéreos en movimiento… ¡Qué interesante!
Lo primero que pienso no es en el radar en sí, sino en el problema que resuelve, porque ese problema lo llevo resolviendo de otra forma desde hace años sin llamarlo por su nombre técnico. Un radar mide la posición de un avión con ruido. Un GPS mide la posición de un coche con ruido. Un sensor SAR mide el desplazamiento del terreno con ruido. En los tres casos hay una señal real escondida detrás de mediciones que saltan, que tiemblan, que nunca coinciden exactamente con la trayectoria verdadera. Y en los tres casos la respuesta es la misma matemática: combinar lo que predice el modelo físico con lo que dice el sensor, ponderando cada fuente según cuánto te fías de ella.
SolarScope: cuando el catastro, el LiDAR y el sol se sientan a la misma mesa
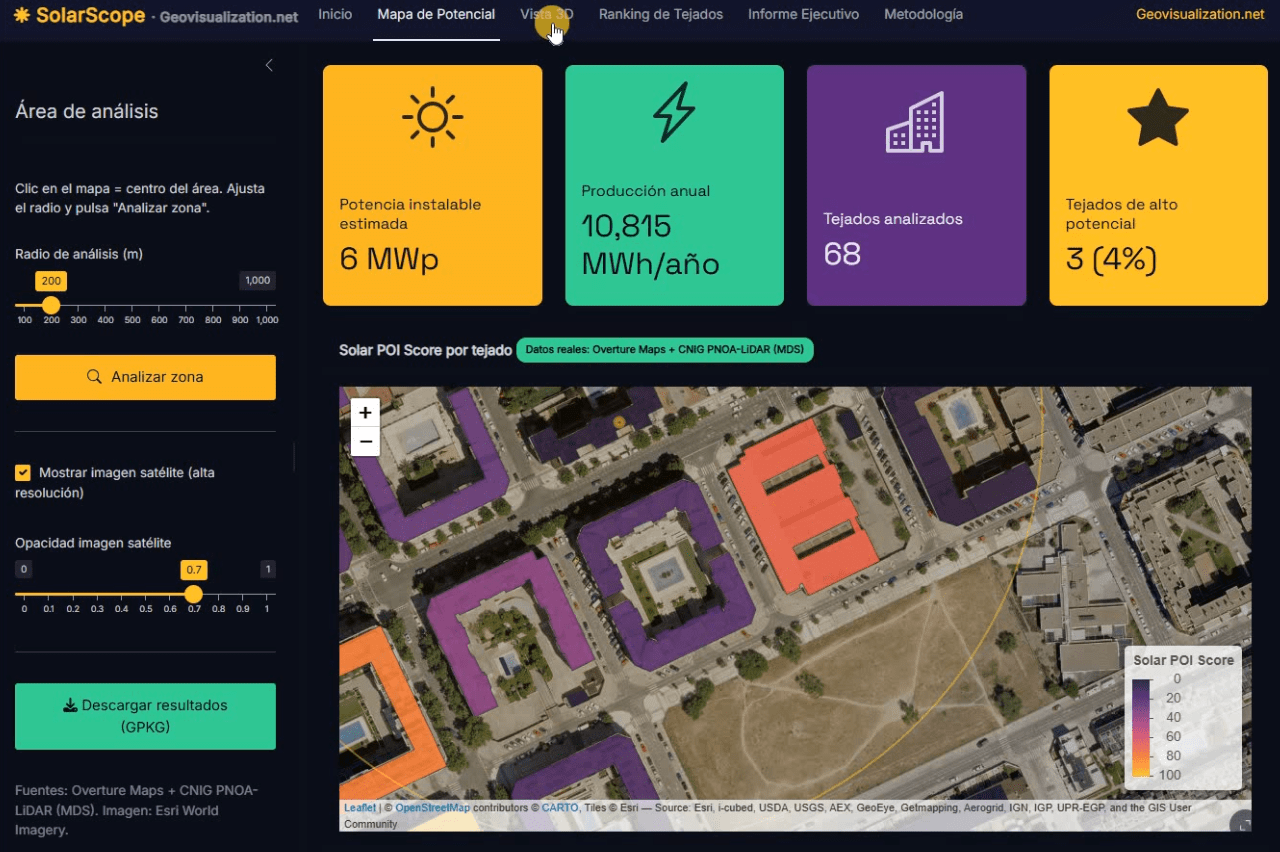
Llevo unos días dándole vueltas a una idea que, en el fondo, es bastante sencilla: si tenemos la huella de cada edificio, su altura y un modelo digital de superficies de alta resolución, ¿por qué seguimos viendo estudios de potencial solar que tratan los tejados como manchas homogéneas sobre un mapa? De esa pregunta, y de unas cuantas sesiones intensas de R, ha salido SolarScope, una aplicación Shiny que estoy desarrollando para hacer scoring de potencial fotovoltaico tejado a tejado, con datos abiertos y un flujo que se puede reproducir tanto en España como en Estados Unidos.
POI Intelligence for Urban Asset Analysis in RStudio: assetIQ
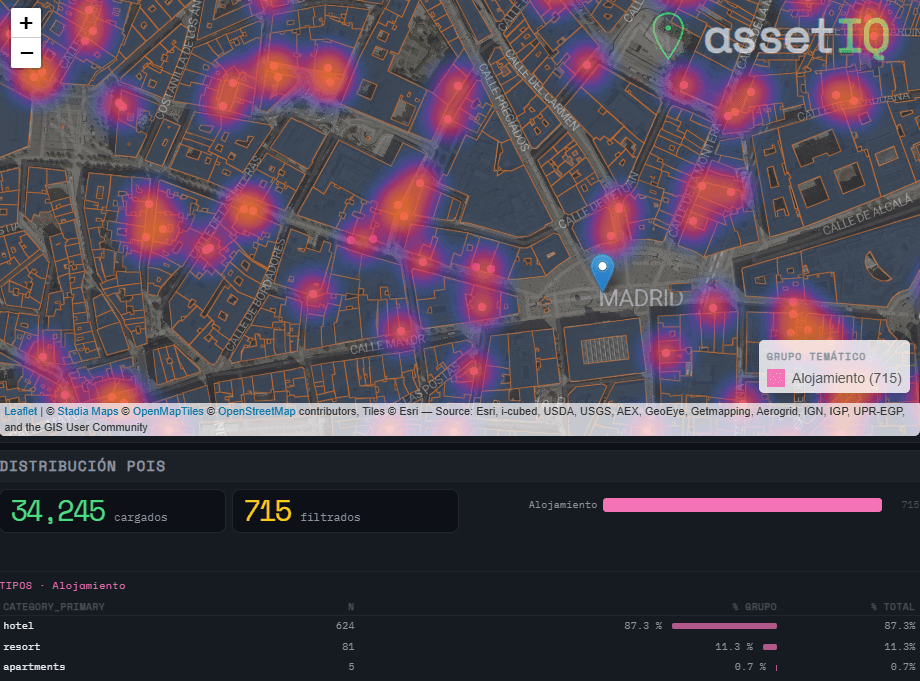
When analysing urban assets, there is genuine value in moving beyond generic neighborhood scores. The density of a coffee shop cluster, the proximity to a financial hub, or the concentration of accommodation around a transport node are signals that traditional datasets flatten into averages — or ignore entirely. assetIQ was built to change that. assetIQ is an R application powered by DuckDB and Overture Maps that extracts, classifies, and scores Points of Interest (POIs) for any location on Earth. You define a city and a search radius — from 100 meters to 25 kilometers — and the tool queries the Overture Maps Places dataset in real time, classifying each POI into thematic groups: Food & Drink, Retail, Health, Education, Transport, Accommodation, Financial Services, Leisure & Culture, Sport, and more.
The core output is an attribute value called POIQ: a normalized 0–1 score assigned to every building footprint within the area of interest, derived from a Kernel Density Estimation of the selected thematic group. A building in a dense retail corridor scores close to 1. An isolated residential block far from any commerce scores close to 0. This transforms thousands of individual points — which in raw form tell you very little — into a single, interpretable attribute per building, ready for downstream modelling, valuation, or site selection.
CHANGE DETECTION ARCGIS PRO AND LIVING ATLAS 2017-2025
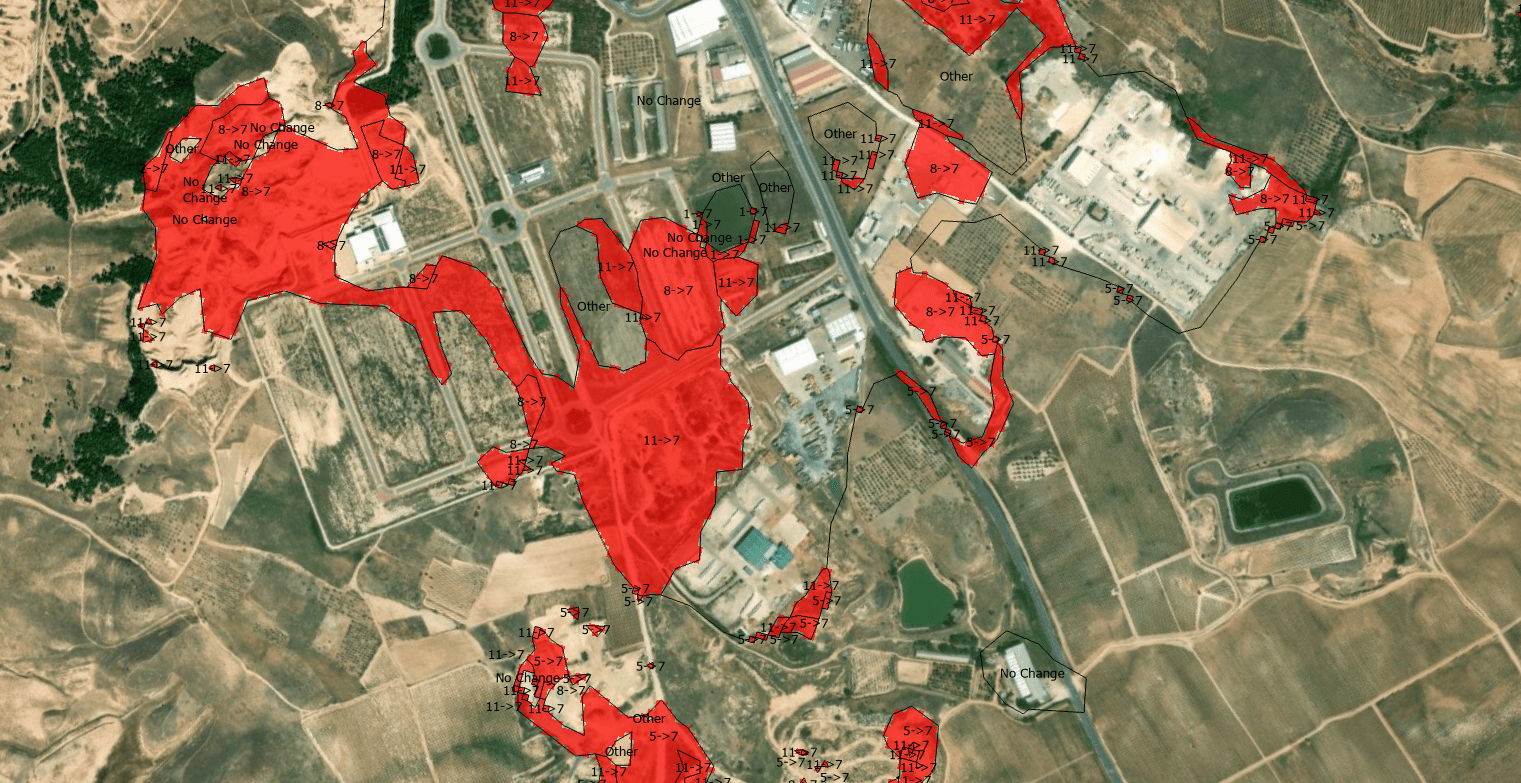
The quantification of land-use dynamics necessitates a spatiotemporal framework that ensures categorical stability over long-term observation windows. The ESRI 10-Meter Global Land Cover time series, accessible through the ArcGIS Living Atlas, provides a harmonized baseline for this purpose, derived from the dense temporal stack of the ESA Sentinel-2 mission.
Urban development in Madrid from the mid-19th century to the present day

All existing buildings in Madrid currently listed in the Land Registry database have their year of construction recorded. This map shows, by decade, where the bulk of that urban development took place. For example, in the 1920s it was in the Salamanca district, in the 1930s in Chamartín… shifting from development in the city centre to the outskirts.
Bienvenido a Madrid Río, donde el carril único lo usa todo el mundo… pero solo la mitad lo usa bien
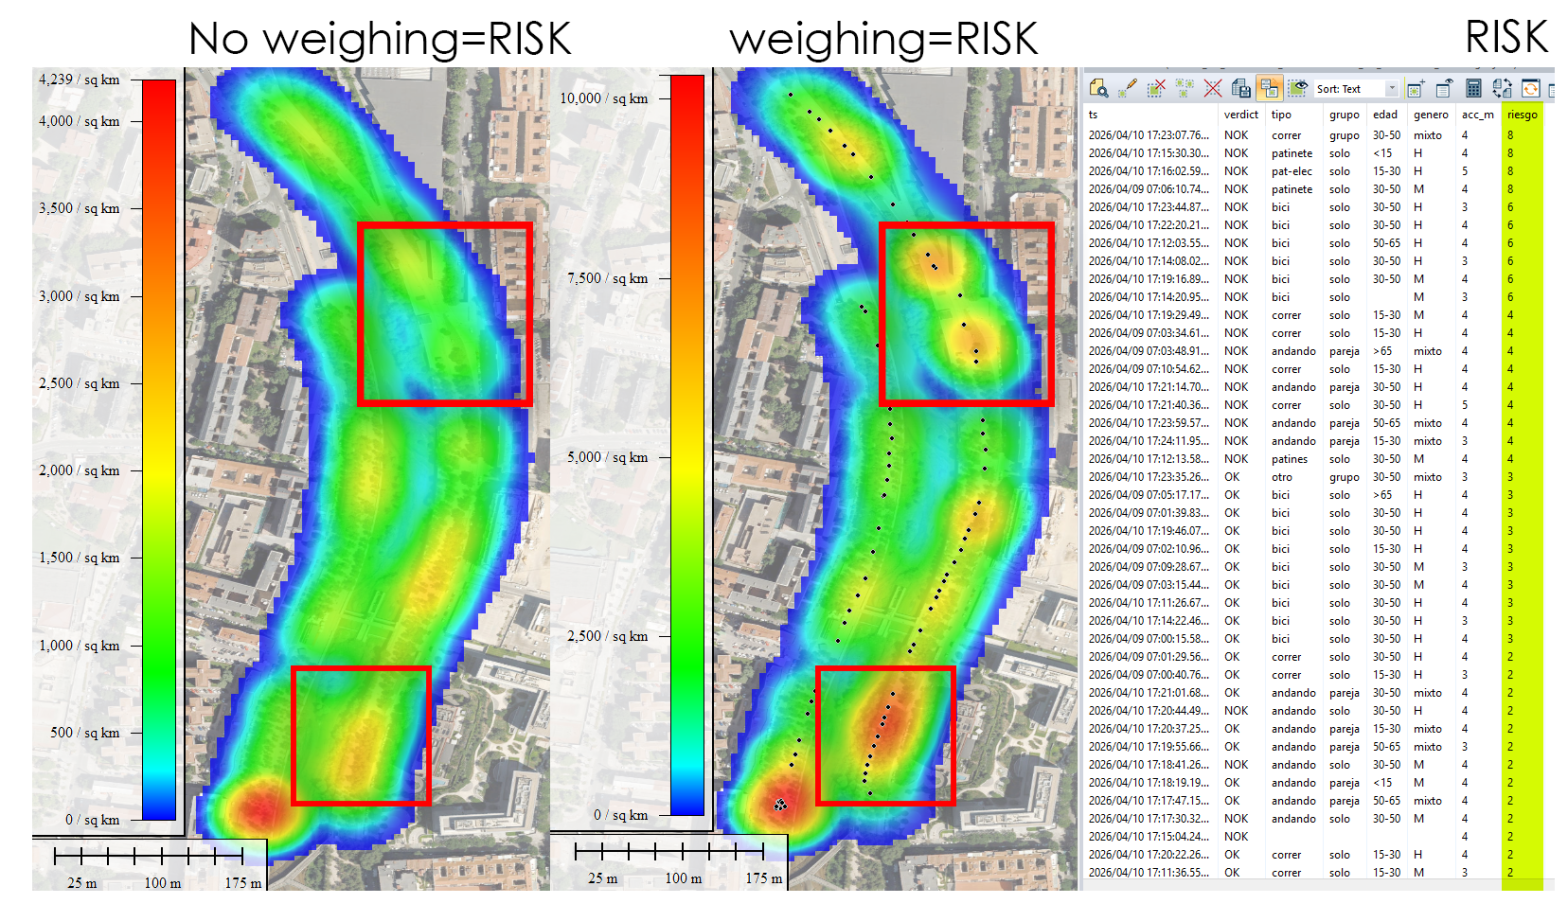
Y cuando eso ocurre, se genera un caos silencioso. Normalmente se resuelve en segundos con ese equilibrio dinámico tan mediterráneo que tenemos —un quiebro, una mirada, un gesto— pero no siempre. He visto bicis arrollar a personas que iban por su lado. Grupos andando en paralelo, bloqueando la vía entera. Patinetes a velocidad de vértigo a punto de llevarse por delante a un niño que, irónicamente, iba exactamente donde debía. Yo mismo llevo usando esta vía desde casi su inauguración, hace más de once años, y puedo decir que el problema no ha mejorado: ha crecido, a medida que el carril se ha llenado de nuevas tipologías de movilidad.
¿Qué quiero hacer? Quiero medir esto. Con rigor, con datos, y con herramientas actuales. Mi objetivo es retratar estadísticamente quién va en el sentido correcto y quién no, desagregando por tipo de movilidad, edad, género y comportamiento en grupo. ¿Son los ciclistas los que más incumplen, o los patinetes eléctricos? ¿La gente mayor es más respetuosa que los jóvenes? ¿Los grupos de tres o más personas son el mayor factor de caos? No lo sé aún. Pero lo voy a descubrir.
Population Estimation through Dynamic LULC-Based Settlement Validation
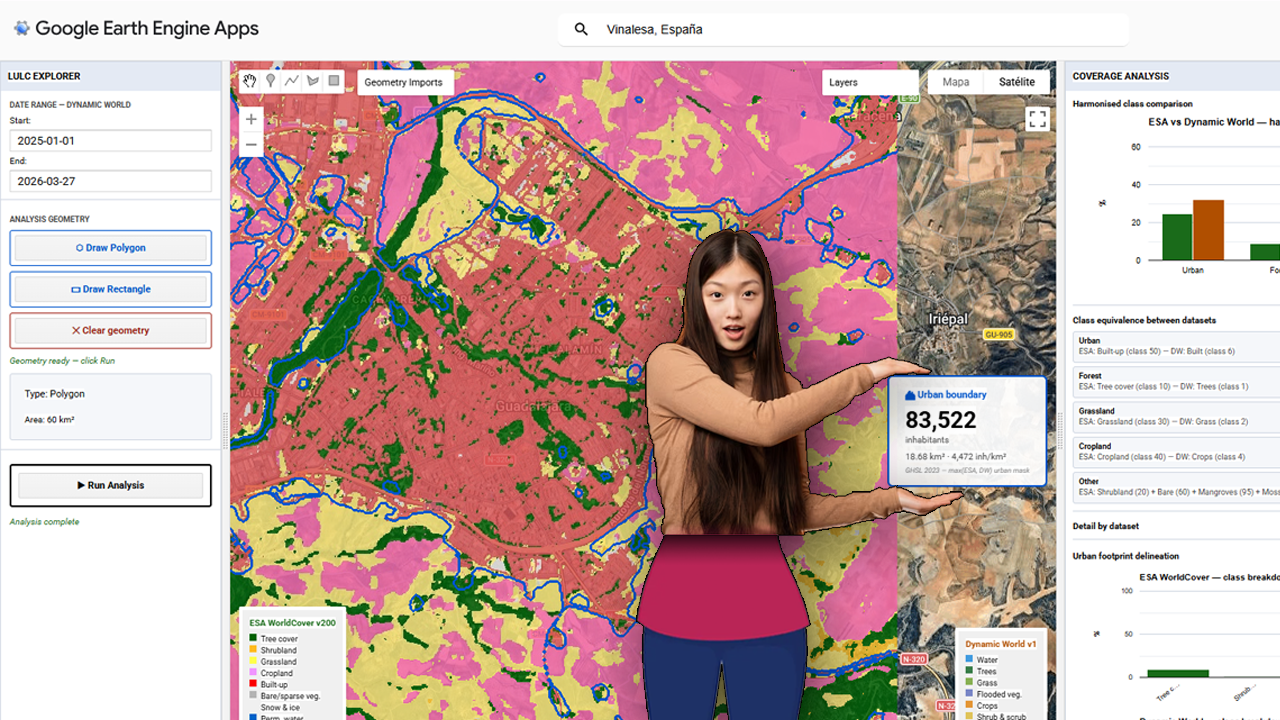
The foundational step of this methodology involves the deployment of a centralized processing interface within the Google Earth Engine (GEE) environment. The provided visualization captures the core interface of the custom GEE application, which serves as the hub for the multi-sensor LULC validation pipeline. Within this dashboard, users can define a specific Area of Interest (AOI)—highlighted here over the Iberian Peninsula and North Africa—and configure key parameters, including temporal ranges for the acquisition of sentinel-derived products. Crucially, the interface is designed to load and compare two primary datasets simultaneously: Dynamic World (near real-time, probability-based LULC) and ESA WorldCover (10m resolution structured LULC). The contrasting classification schemes are represented by the legends on the left and right sides of the map view, which illustrate the varying definitions of ‘Built-up’ and urban areas between the two products. Establishing this visual and statistical comparison at the application level is the prerequisite for calculating the spatial disagreement threshold, or delta, that guides the subsequent merging and population estimation phases.
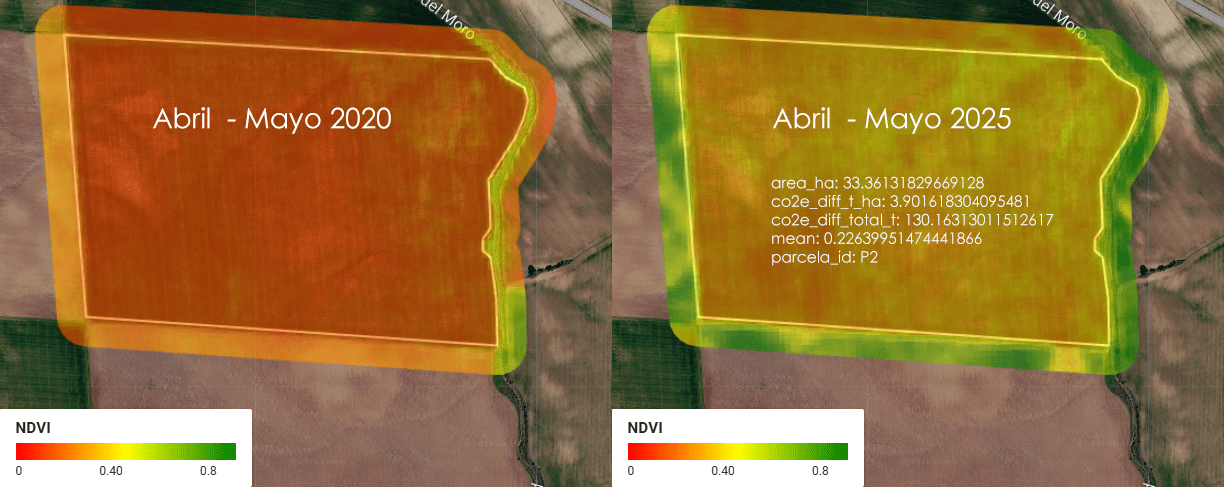
Agricultura de precisión (II). APP para integración con Catastro rural en España
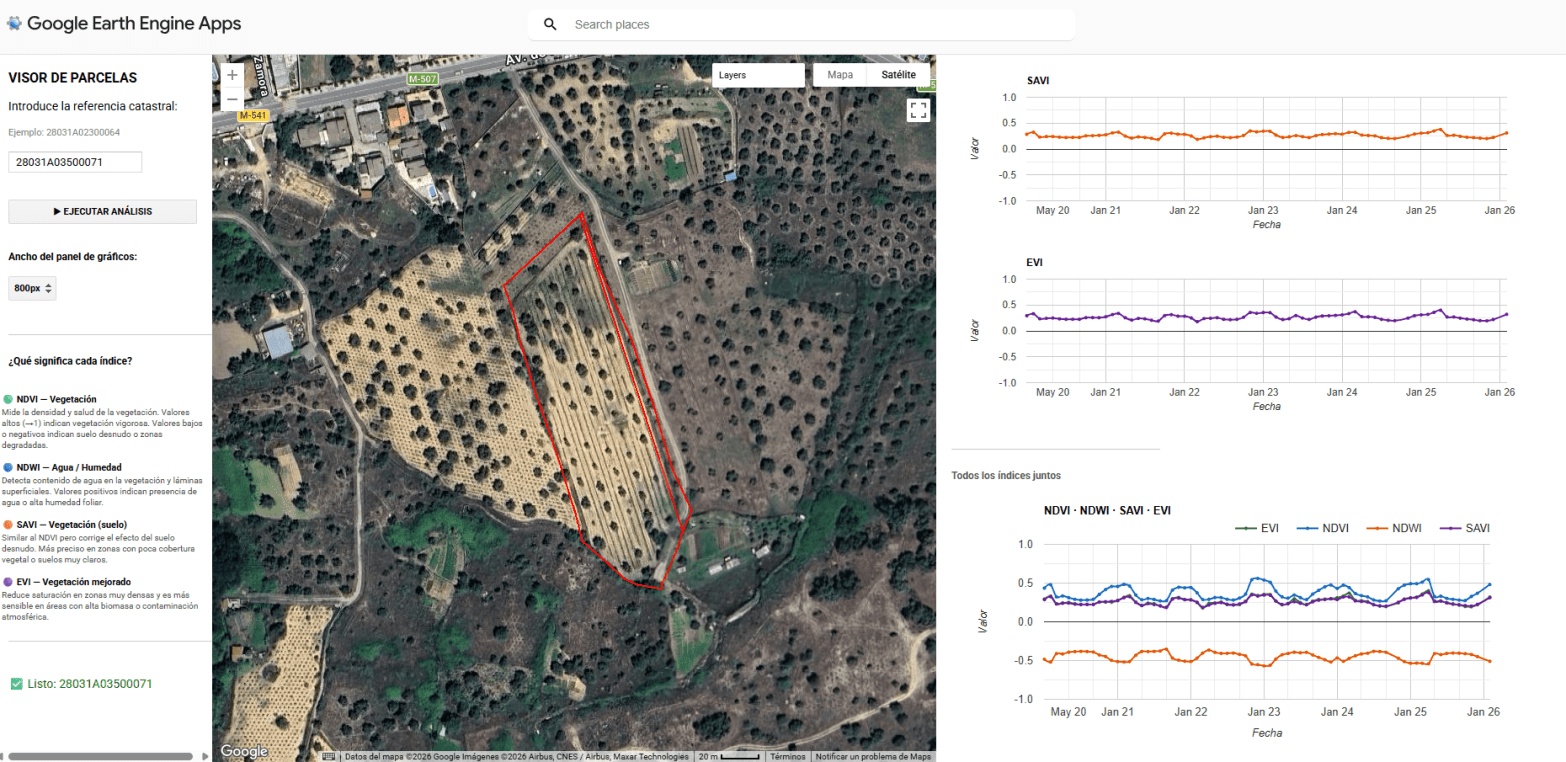
La convergencia entre el Big Data geoespacial y la administración pública ofrece una oportunidad sin precedentes para la optimización agronómica. La capacidad de procesamiento de Google Earth Engine (GEE), vinculada a la cartografía vectorial del Catastro rural, permite transformar las series temporales de misiones como Sentinel-2 en herramientas de diagnóstico directo sobre la parcela. Este enfoque desplaza el análisis de una observación puramente visual a una monitorización cuantitativa basada en la respuesta espectral de los cultivos. El núcleo de esta aplicación reside en la intersección geométrica de las parcelas catastrales con colecciones de imágenes multiespectrales. Mediante el uso de la API de JavaScript en GEE, se automatiza el cálculo de indicadores biofísicos críticos como el NDVI (Índice de Vegetación de Diferencia Normalizada), el NDWI (Índice de Agua de Diferencia Normalizada), el EVI (Índice de Vegetación Mejorado) y el SAVI (Índice de Vegetación Ajustado al Suelo). Estos índices no solo reflejan el vigor fotosintético, sino que permiten identificar anomalías de crecimiento, estrés hídrico o variaciones en la densidad foliar que son invisibles al ojo humano en las fases tempranas del ciclo fenológico.
Setting up Mapterhorn terrain in RStudio
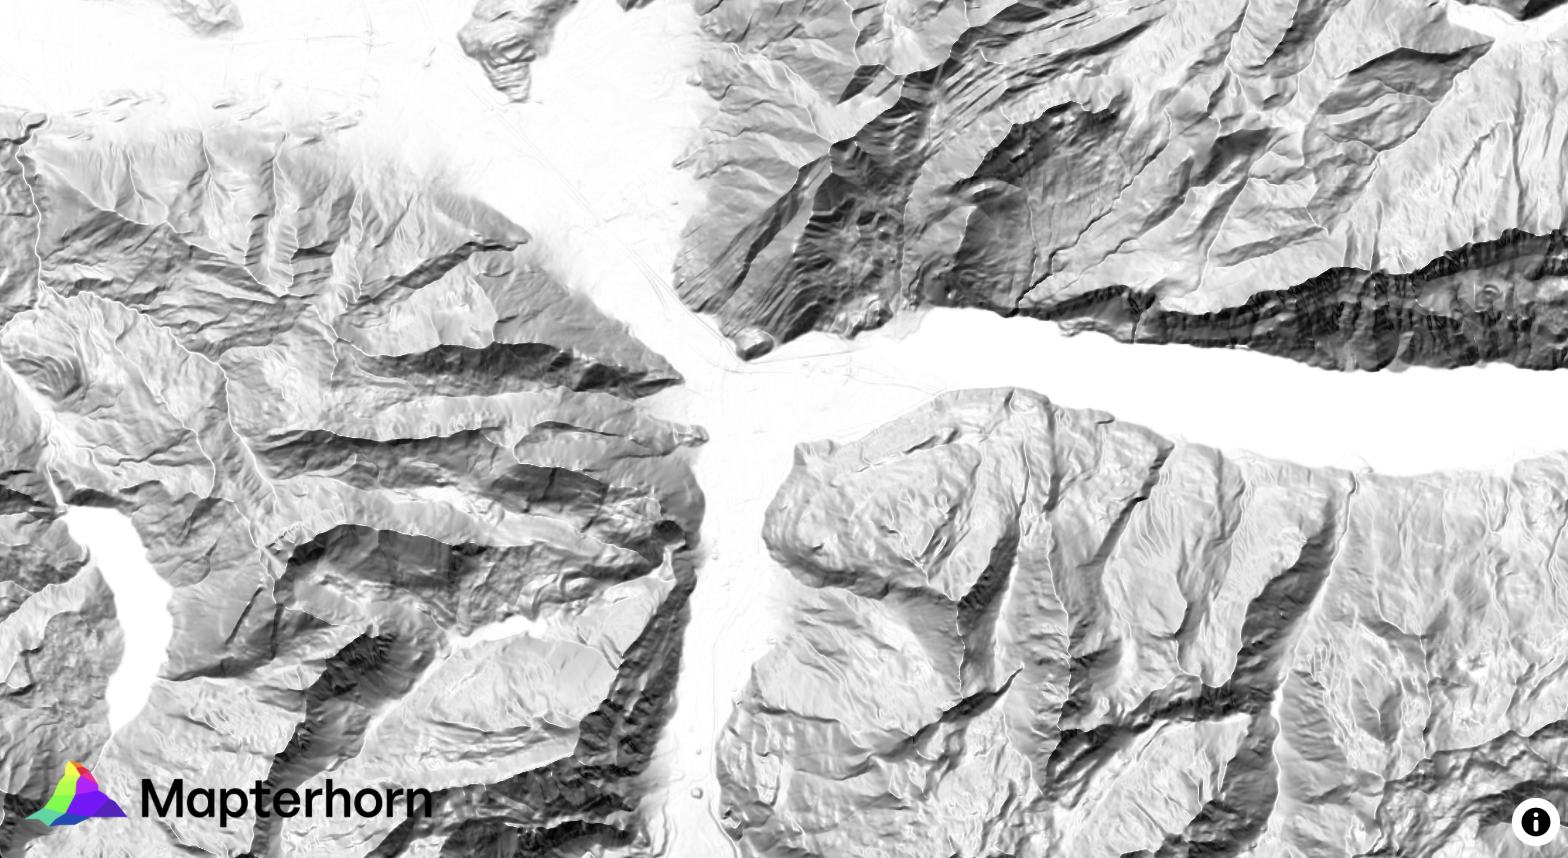
¿Alguna vez has querido visualizar el relieve de un territorio en 3D directamente desde R, sin depender de software GIS externo? Mapterhorn es un proyecto open source que distribuye modelos digitales de elevación (MDT) de alta resolución — hasta 2 metros en España — empaquetados en formato PMTiles, un estándar moderno que permite servir datos geoespaciales sin necesidad de un servidor propio.
En este post veremos cómo configurar Mapterhorn en R usando el paquete mapgl en Rstudio, que nos permite crear mapas interactivos con terreno 3D en pocas líneas de código. El resultado: visualizaciones como la que ves abajo, con sombreado de relieve (hillshade) generado directamente desde los datos de elevación del IGN.
