
All existing buildings in Madrid currently listed in the Land Registry database have their year of construction recorded. This map shows, by decade, where the bulk of that urban development took place. For example, in the 1920s it was in the Salamanca district, in the 1930s in Chamartín… shifting from development in the city centre to the outskirts.
Category Archives: Edición de Vídeo
Aventuras y desventuras de un geógrafo en “desarrollo”
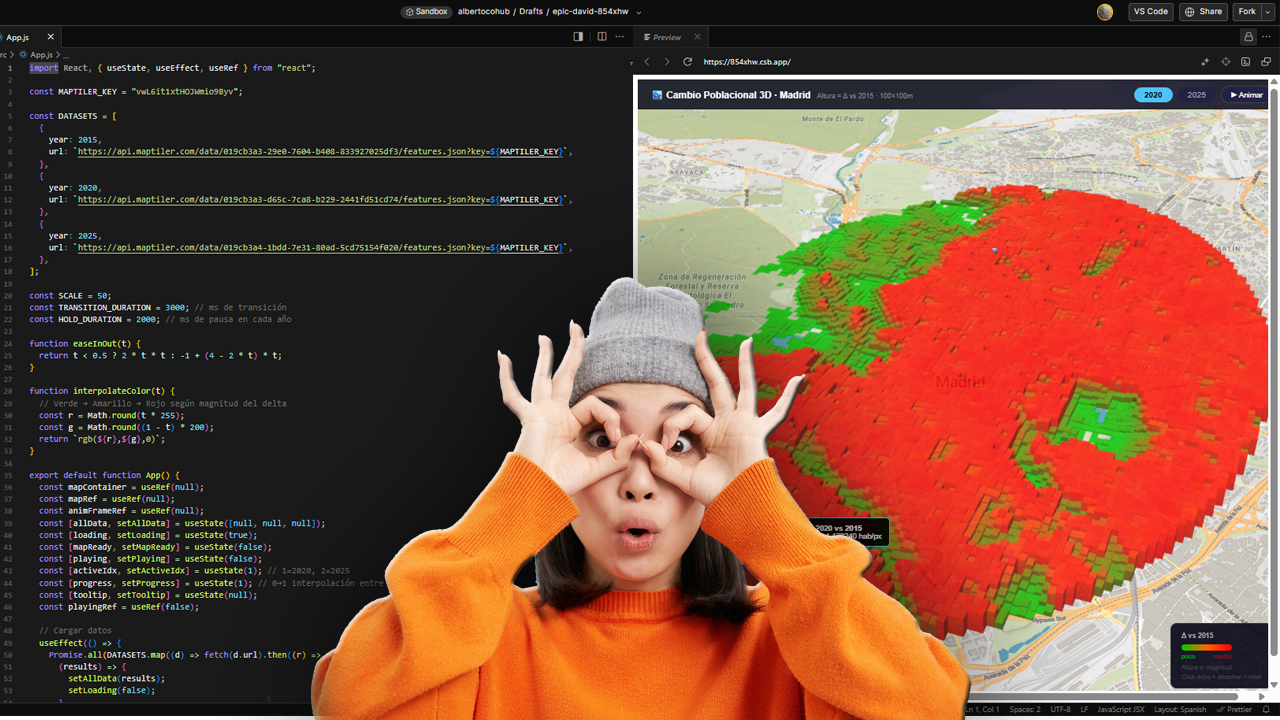
La cartografía siempre ha sido un oficio de precisión, paciencia y criterio espacial. Durante años, el flujo de trabajo de cualquier geógrafo pasaba inevitablemente por entornos de escritorio como ArcGIS Pro o QGIS: cargar capas, ajustar simbología, exportar mapas. Herramientas sólidas, probadas, indispensables. Pero algo está cambiando.
Cada vez más, el análisis espacial ocurre en la nube, en navegadores, en entornos de código. En anteriores post habéis visto algunos test/ideas/aplicaciones que he desarrollado con Javascript Google Earth Engine, que procesa imágenes satelitales a escala planetaria sin mover un solo archivo. Deck.gl y Maplibre renderizan millones de puntos en 3D directamente en el navegador. React convierte un mapa en una aplicación interactiva con pocas líneas de código.
Sequía en Cataluña – Timelapse 2017-2024

Las restricciones más duras de emergencia por sequía se extenderán a más de seis millones de personas de los 202 municipios de Barcelona y algunas poblaciones de Girona. Así lo ha anunciado este jueves la Generalitat, que suma estas localidades a las 37 (125.000 habitantes) de las comarcas de Alt Empordà, Baix Camp y Baix Llobregat, que ya estaban en la fase más severa desde agosto. Esto significa que casi el 80% de la población catalana vive en una zona en emergencia por la crisis hídrica.
Old non internet times and a few different ways of visualizing wind in VENTUSKY application

Have you seen how this helps you to understand the way wind flows? (switching form different variables visualization styles)
Visualizing Tweets!
How about a quick visualization of tweets in CartoDB? Hey guys, the way we used to visualize is changing on a daily basis so it’s time to catch up!!!. Let’s add a timestamp and play!! We will take a look at this dataset in depth shortly so be aware of our schedule! Regards, Alberto C.MScContinue reading “Visualizing Tweets!”
Comparing France Meteo and Spain Meteo from the visualization point of view
After living in France for four years i have to tell i am always aware of Meteo information on TV (well, i live in Brittany, i guess this makes sense!). It was the same in Spain or anywhere else in the world where i had lived and the reason why is i have always lovedContinue reading “Comparing France Meteo and Spain Meteo from the visualization point of view”
Visualization will endure these difficult years of CRISIS!!
I have already worked as a building cleaner, data capture operator, copywriter, photographer, graphic designer, video editor, technical salesman… and seriously, I think i’m too old to make a living in something else now… GIS has been working for me the last 8 years and i want to stay like this!!!:-) I have just read inContinue reading “Visualization will endure these difficult years of CRISIS!!”
Cool data. What is this?
What is this ‘cool data‘ all about?. When i got my degree in Geography (about 15 years ago) it didn’t make sense at all being interested in something like graphic design, photography, video and all this stuff… but not only interested in my leisure time but also for taking advantage of it, getting a lifeContinue reading “Cool data. What is this?”
Coverage map video over Bogotá, Colombia
A few months ago i prepared some scenarios over the city of Bogotá. Hope you guys like it.
Solar + Shadows analysis on Rue Massillon, Nantes (France)
This is the beautiful building in from of my house in Nantes… Let’s model it first using Sketchup. Also I have used a non standard style only for visualization purposes… If we have the North behind us this means we are going to have a lot of light… but so far we are just guessing… Now weContinue reading “Solar + Shadows analysis on Rue Massillon, Nantes (France)”
