Below you can see the example timelapse of Suez Canal ship traffic, made with a Sentinel-1 custom composite visualization. You can observe the moving ships as time passes.
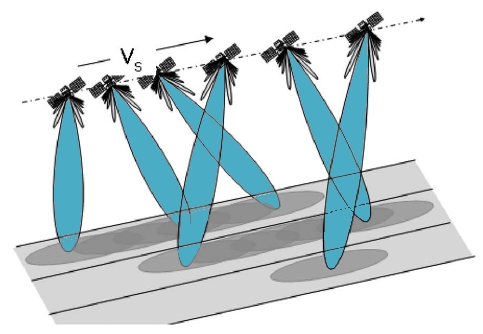
Sentinel-1 is a pair of European radar imaging (SAR) satellites launched in 2014 and 2016. Its 6 days revisit cycle and ability to observe through clouds makes it perfect for sea and land monitoring, emergency response due to environmental disasters, and economic applications. This dataset represents the global Sentinel-1 GRD archive, from beginning to the present, converted to cloud-optimized GeoTIFF format.
Tag Archives: visualization
Tendencia de la Tasa de Incidencia Acumulada en Madrid a 20210325

Comparando siempre la semana en curso con la anterior, midiendo las variaciones porcentuales y viendo hacia dónde vamos. Como se aprecia, cada vez hay más ZBS (Zonas Básicas de Salud) donde los datos de la semana presente son peores que los anteriores, lo que no pinta muy bien!.
Running in Madrid. A GIS approach!

these density maps performed in Global Mapper overlay the geometry lines saved out my running application (Garmin Connect). and once they are exported to points, i can generate a density map, chosing an easy to understand legend and i overlay to Google Earth so its also easy to be sent if needed be (why for? i don’t know!).
Visualizing Tweets!
How about a quick visualization of tweets in CartoDB? Hey guys, the way we used to visualize is changing on a daily basis so it’s time to catch up!!!. Let’s add a timestamp and play!! We will take a look at this dataset in depth shortly so be aware of our schedule! Regards, Alberto C.MScContinue reading “Visualizing Tweets!”
Visualization will endure these difficult years of CRISIS!!
I have already worked as a building cleaner, data capture operator, copywriter, photographer, graphic designer, video editor, technical salesman… and seriously, I think i’m too old to make a living in something else now… GIS has been working for me the last 8 years and i want to stay like this!!!:-) I have just read inContinue reading “Visualization will endure these difficult years of CRISIS!!”
Coverage map video over Bogotá, Colombia
A few months ago i prepared some scenarios over the city of Bogotá. Hope you guys like it.
Visualizing Telco datasets using SpaceEyes 3D
Hi again, I have started using this visualization engine to overlay standard ortho imagery, DTM datasets and telecomunication specific datasets… All i can say so far is that it works pretty well!!!. Being able to understand the scope of land use dataset while we swipe different types of images… it works!! In this particular case a landContinue reading “Visualizing Telco datasets using SpaceEyes 3D”
ViewTec’s State-of-the-art 3D visualization
Good news!!!! They’ve probably released this Geovisualization Engine long time ago (It used to be an ‘in-house’ software) but I have just realized. I worked with this state-of-the-art TerrainView 3D software for six months while I was working as a GIS Specialist in Cape Town (South Africa)… What does this software has that no oneContinue reading “ViewTec’s State-of-the-art 3D visualization”
Visualizing LAS LIDAR data with sketch-up
While trying to figure out the way to get a 3D model from raw Lidar data, I first opened my LAS file in Global Mapper, exported it to DXF, imported then into Sketch-up and after recording a few scenes, I saved the animation… this is it!. Alberto
