
Love running. I have been running without stop (well, three months after my Marathon in Valencia i had to stop due to a minor surgery) for the last -almost- four years. I love running and and love GIS and statistics. This is a bomb combination.
I wanted to figure out visually where i normally run. Well, i know it, that’s true, but its just what i remember, i go here and there. I love running in Casa de Campo and in Parque Lineal del Manzanares mostly, but not only. Also i have run in every country i have the chance to visit, normally for business purposes.
I have run in South Africa (Cape Town), in Tunis (Tunis), in Santiago (Chile), in Lima (Peru), in Cannes (France) and i dont even remember where else… 
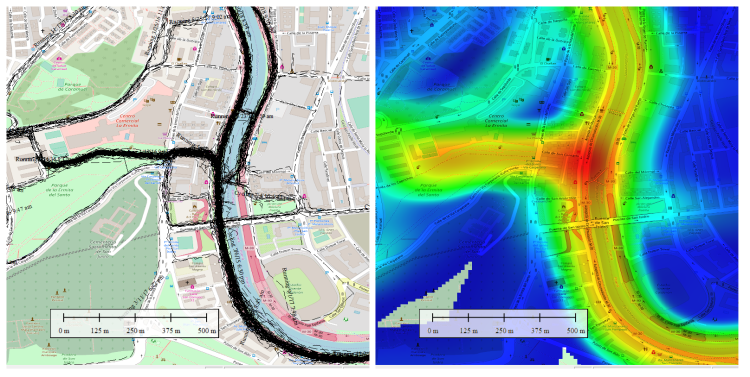
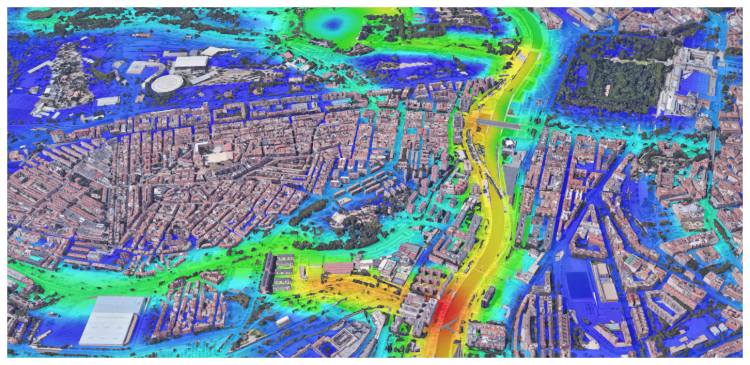
Anyway, these density maps performed in Global Mapper overlay the geometry lines saved out my running application (Garmin Connect). and once they are exported to points, i can generate a density map, chosing a legend easy to understand and i overlay to Google Earth so its also easy to be sent if needed be (why for? i don’t know!).


Anyway, hope you guys like it.
Alberto C.
MSc GIS
