Esta pasada semana he tenido el honor de viajar a Lima (Perú) para participar en el el Primer Foro Nacional de Ciencias de Datos Espaciales como herramienta eficaz para la gestión pública estos pasados 18-19 Julio 2023 en el Centro de Convenciones de Lima, Perú. Mi ponencia era sobre el DIGITAL TWIN en la ciudad de CUZCO así como el BRIGHT EARTH CITY TEXTURING, una solución de texturización procedural con semántica 3D de bajo mantenimento de mi empresa Luxcarta, un gran adelanto tecnológico de nuestro departamento de I+D.
Tag Archives: geovisualization
Learning to use GOES constellation
GOES satellites continually view the continental United States, Pacific and Atlantic Oceans, Central and South America, and Southern Canada. To fully cover Alaska, Hawaii, the entire continental United States and the Pacific and Atlantic Oceans (for tropical storms), NOAA operates two GOES satellites simultaneously
Measuring snow coverage using EOB – Earth Observation – Sentinel HUB
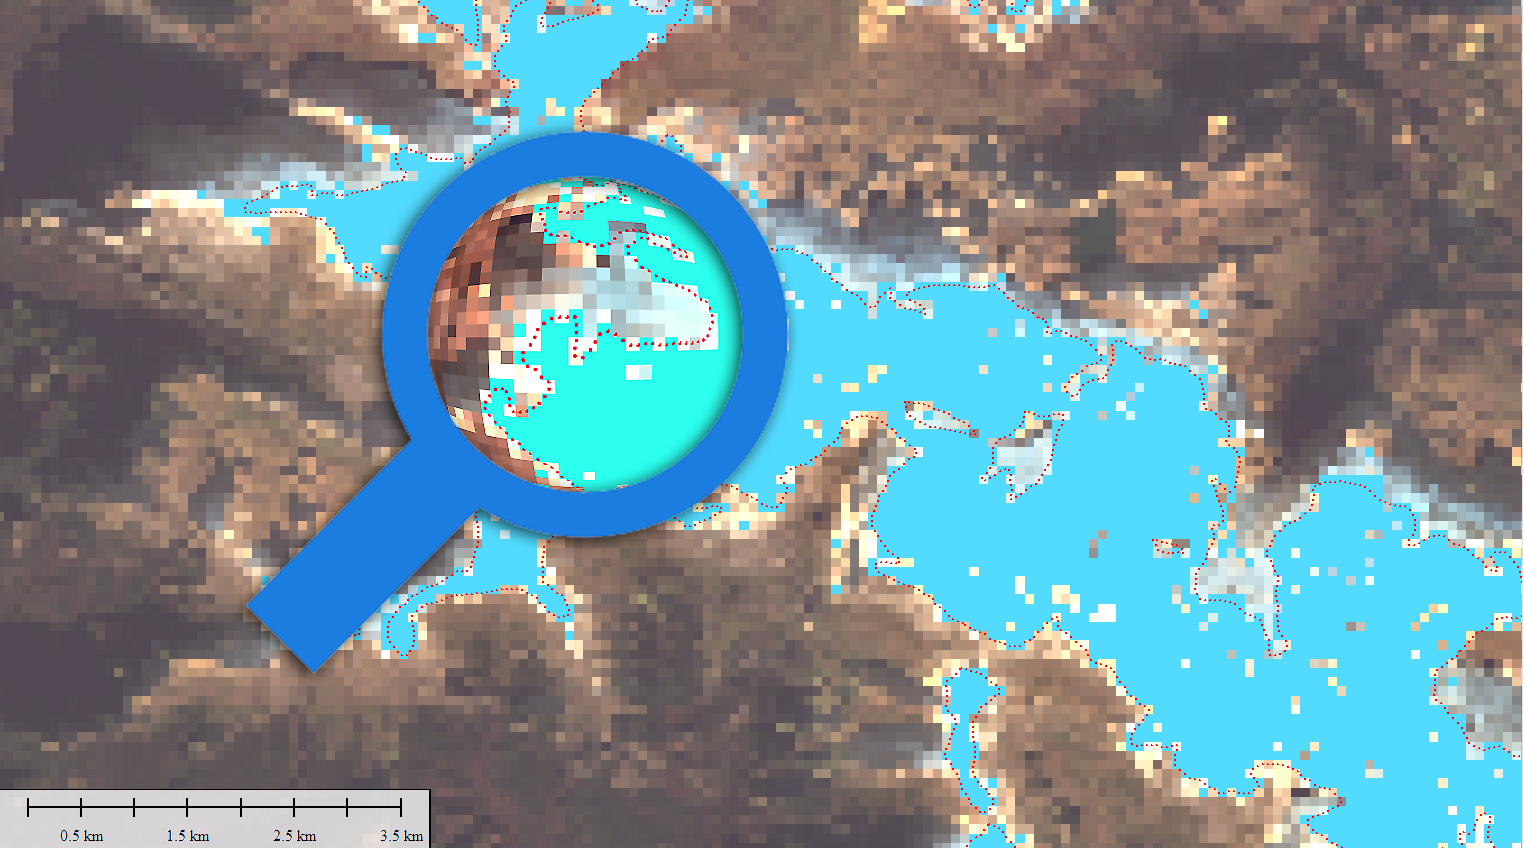
Playing with Sentinel 2 images I realized that the amount of snow this year has been very low compared to last winter. Here are a couple of images from January 2022 and 2023 of the Canfranc – Paticosa – Jaca area. One of the most interesting things about this EO browser is that in addition to a standard 2D visualisation, we can visualise in 3D. Here is an video example. Another interesting thing is to be able to quantify the snowfall. There is a snow classifier based on NSDI (Normalized Difference Snow Index, The Normalized Difference Snow Index (NDSI) snow cover is an index that is related to the presence of snow in a pixel and is a more accurate description of snow detection as compared to Fractional Snow Cover (FSC).
NO AL PELOTAZO DE LA ERMITA DEL SANTO
Esta semana pasada he estado colaborando puntualmente con la Plataforma “planermitadelsanto”, vecinos como yo que se han (nos hemos) organizado para echar abajo un plan de recalificación urbanística que no es ni mucho menos del interés general. He preparado para ellos algunos mapas en 3D (georeferenciando planos, extruyendo manualmente usando datos del Plan propuesto, realizandoContinue reading “NO AL PELOTAZO DE LA ERMITA DEL SANTO“
Google Earth Engine and Dynamic World
Let me please introduce you this “new” LULC source I have come across with recently. The potential of this 10m “clutter” source is being able to acquire data from a few days ago instead of using outdated “very old” 2020 vintage datasets. I know if these days something 2020 is very old then myself, born in 1972 then i’m older than the riverside, older than peeing in a wall, even older than Methuselah. Yes, that’s the way it is nowadays.
Google Earth Engine is a geospatial processing service where you can perform geospatial processing at scale, powered by Google Cloud Platform. The purpose of Earth Engine is to:
Provide an interactive platform for geospatial algorithm development at scale
Enable high-impact, data-driven science
Make substantive progress on global challenges that involve large geospatial datasets
Measuring moisture: Normalized Difference Moisture Index (NDMI) Sentinel-2 2022
I am here in front of my desktop and I wonder how to take advantage of Sentinel Hub for tracking up moisture in a random plot anywhere in the world. Has it been irrigated at the right time for the type of crop? How has rainfall been affected over the analysis time? How has the use of certain fertilisers affected it? Has it positively affected production?. Let’s take a closer look.
Marathon à Nantes 2022: CHECKED!
J’ai toujours cru que faire les choses selon un plan facilitait la réalisation de ce que vous aviez prévu de faire, eh bien, quand il s’agit de courir un Marathon, c’est la clé. Lors de mon troisième Marathon après Valencia en 2017 et Madrid en 2019, on constate une meilleure tendance par rapport au nombre de kilomètres de préparation.
Visualising Wind from a GRIB Mesh Layer in QGIS and Create an Animated GIF
For a brief introduction into this new GRIB Mesh format (new to me) I followed step by step this tutorial bellow I had found in Hans Van der Kwast YouTube channel, it happened to be very good source and I finally made it (see below). The idea was analysing the winds during a Storm in the Netherlands (this storm was actually the 14th of March 2022 but I analyzed the 15th, no impact on the tutorial whatsoever but please note this point).
¡Viento del Sahara en España! ¡Sí!
De repente se levanta uno y ve los coches, los marcos de las ventanas y las aceras llenos de arena… ¿Qué es esto?, ¡Uno quiere comprender más en detalle! Si esto es en Madrid, qué no ocurrirá en Murcia (que está de camino)!! 🙂 Lo cierto es que si tomamos las imágenes del SENTINEL 5P Aerosol index podemos ver cómo en esa longitud de onda encontramos aerosoles. ¡Y muchos! ¿Y hacia dónde se desplazan?. Directos al centro de la península.
¡+7,000km corriendo!
Ayer llegué a los 7,000km corriendo desde que empecé allá por Agosto de 2014. Parece que no es nada pero es como si hubiera llegado desde Madrid a la ciudad de Karagandá en Kazajistan… Sí es mucho para mí, que empecé andando porque no podía correr. Hay muchas cosas que me ha dado correr, un espacio para mí y mis pensamientos, saber que soy capaz de hacer algo de forma consistente y lograr mis objetivos (razonables). No importa que llueva, nieve o granice, ahí sale Alberto con sus pantalones cortos a darlo todo.


