
One of those new GIS formats is the GRIB Mesh, what is it?. A Grib Mesh is a multidimensional raster data and commonly used in meteorology to store historical and forecast weather data.
Multidimensional raster data is often used in the scientific community to store meteorological and oceanographic data such as temperature, humidity, wind speed, and direction. Data is normally stored as variables, where each variable is a multidimensional array that represents data captured at multiple times, and at multiple heights, depths or pressures. These data are often stored in NetCDF, HDF, or GRIB file formats, which are supported in ArcGIS Pro and QGIS.
GRIB—General Regularly-distributed Information in Binary is a concise data format commonly used in meteorology to store historical and forecast weather data. The GRIB raster type allows you to add GRIB 1 and GRIB 2 data into a mosaic dataset.
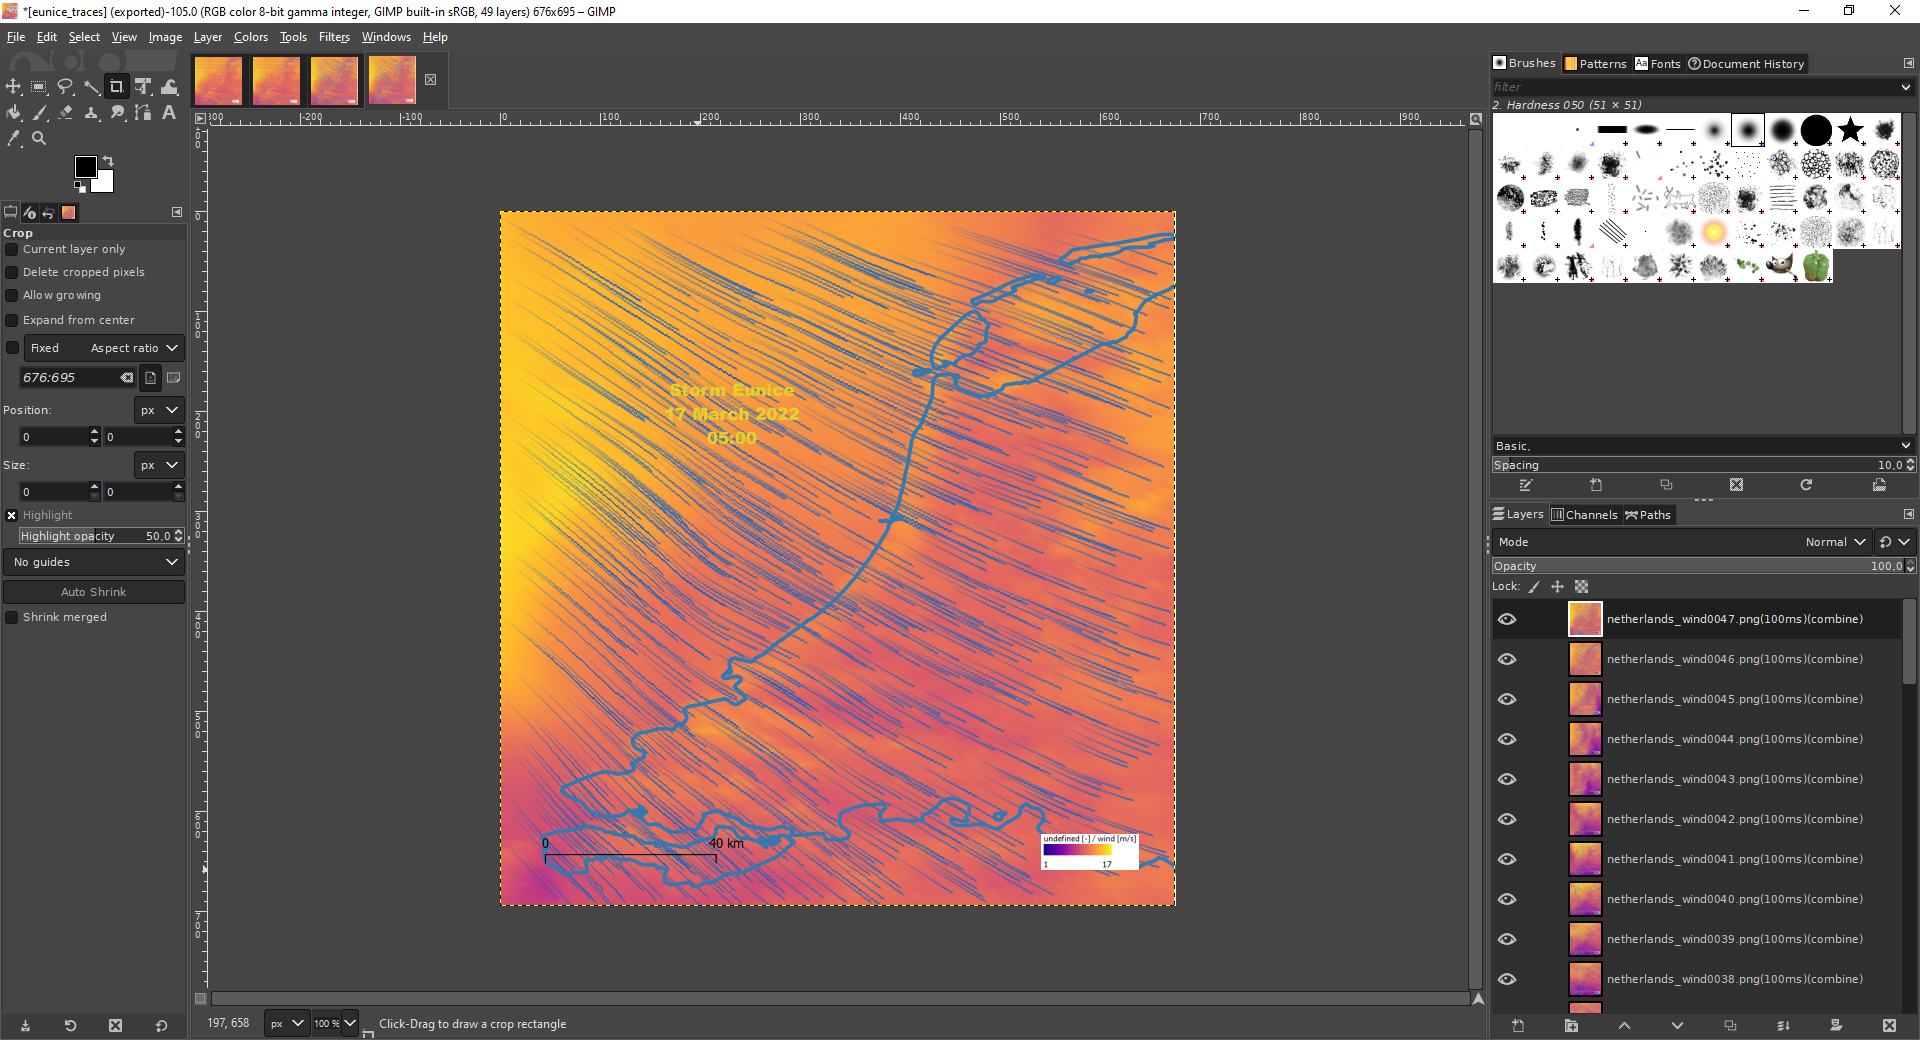
For a brief introduction into this new GRIB Mesh format (new to me) I followed step by step this tutorial bellow I had found in Hans Van der Kwast YouTube channel, it happened to be very good source and I finally made it (see below). The idea was analysing the winds during a Storm in the Netherlands (this storm was actually the 14th of March 2022 but I analyse the 15th, no impact on the tutorial whatsoever but please note this point).
All you need for getting this done is QGIS (I used 3.20.3 Odense) for handling data and visualization and Gimp (2.10) to do the GIFs.


Sources:
Hans van der Kwast Youtube channel
https://www.euroszeilen.utwente.nl/weer/grib/
http://www.gimp.org.es/descargar-gimp.html
https://support.esri.com/en/technical-article/000024025#:~:text=A%20GRIB%20file%20is%20a,multiple%20dimensions%20in%20ArcGIS%20Pro.
https://pro.arcgis.com/en/pro-app/latest/help/data/imagery/multidimensional-raster-types.htm
https://www.youtube.com/watch?v=C0ewmWrRv1c&ab_channel=WorldIsDangerous
https://maritima.meteoconsult.es/servicios-marino/archivos-grib (GRB files, Europe)
