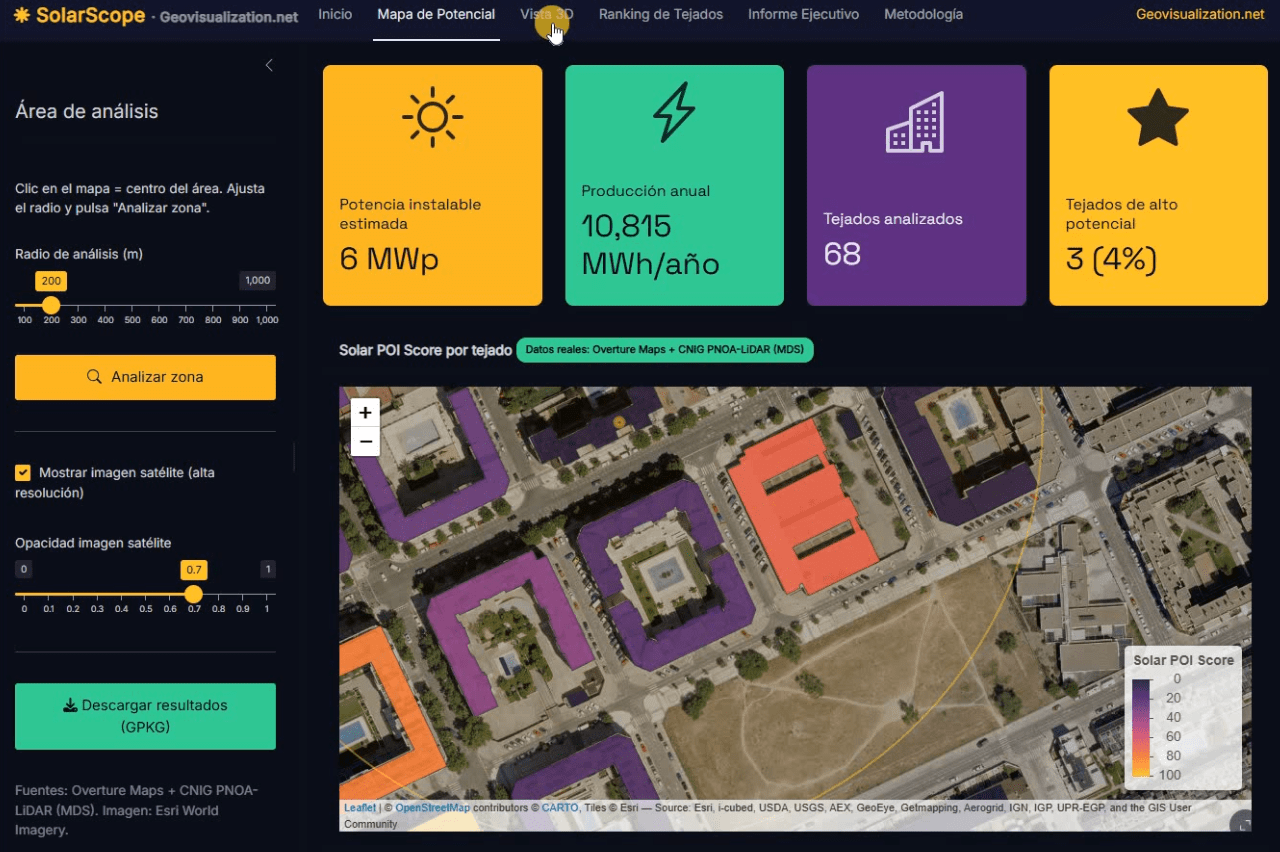
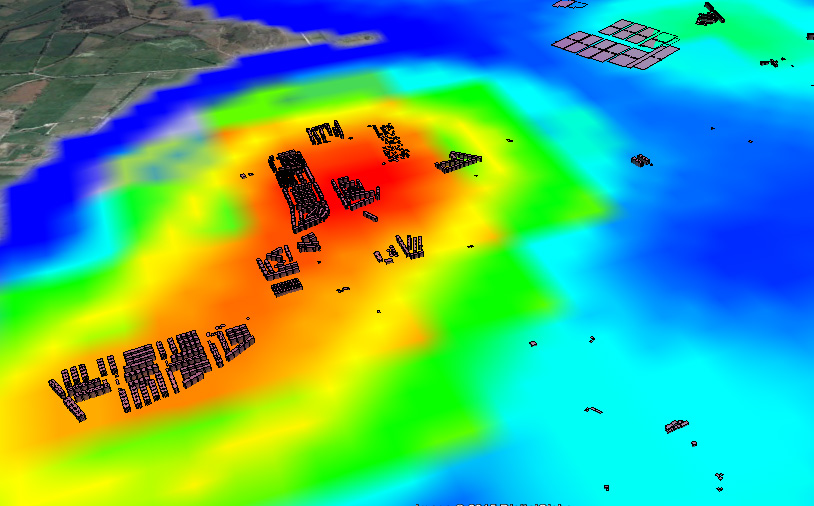
Llevo unos días dándole vueltas a una idea que, en el fondo, es bastante sencilla: si tenemos la huella de cada edificio, su altura y un modelo digital de superficies de alta resolución, ¿por qué seguimos viendo estudios de potencial solar que tratan los tejados como manchas homogéneas sobre un mapa? De esa pregunta, y de unas cuantas sesiones intensas de R, ha salido SolarScope, una aplicación Shiny que estoy desarrollando para hacer scoring de potencial fotovoltaico tejado a tejado, con datos abiertos y un flujo que se puede reproducir tanto en España como en Estados Unidos.
Tag Archives: analysis
Time Series Analyzer: Análisis multitemporal de índices espectrales en Google Earth Engine
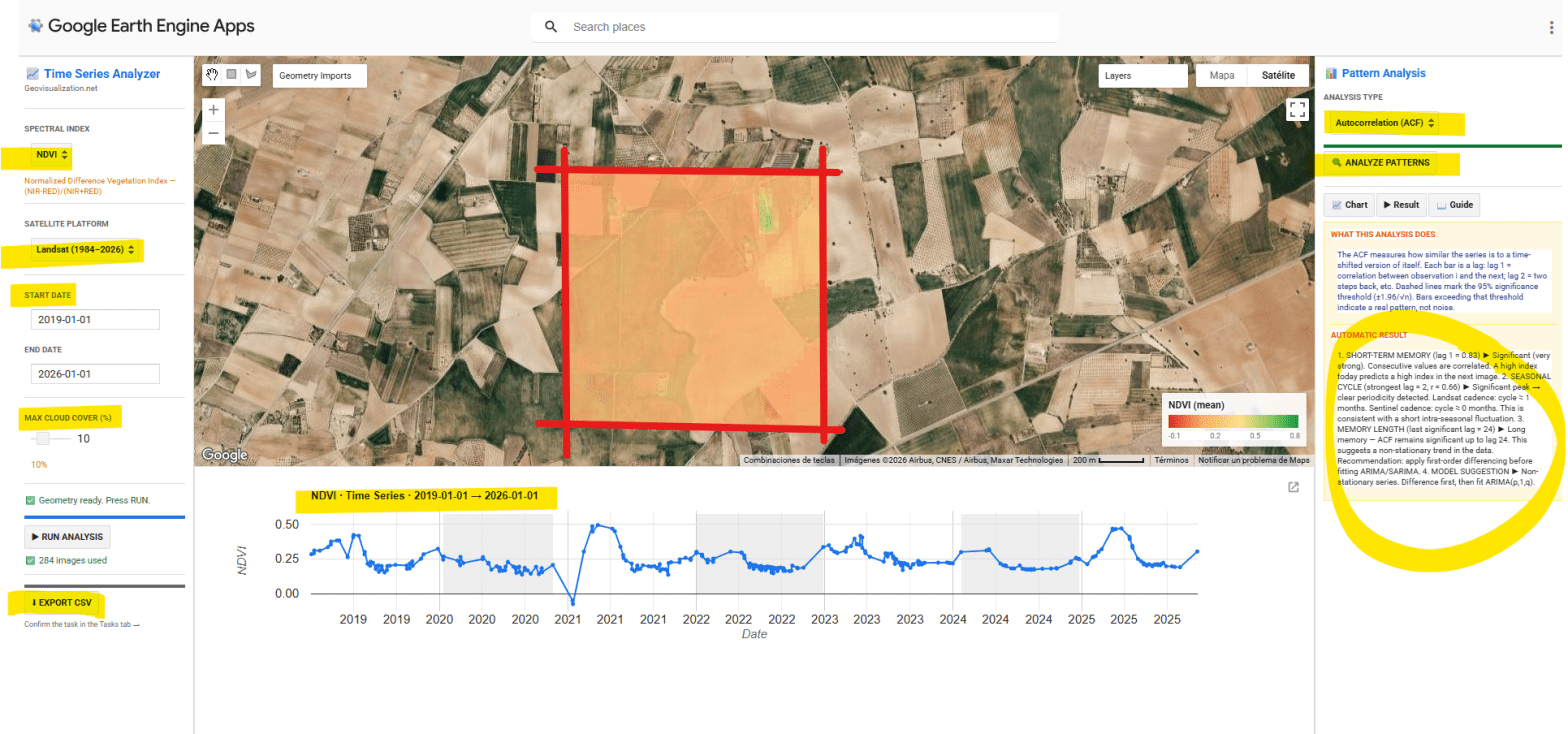
He desarrollado una aplicación interactiva en Google Earth Engine para la extracción y análisis estadístico automático de series temporales de cinco índices espectrales (NDVI, EVI, SAVI, NDWI y NBR) sobre cualquier geometría definida por el usuario en cualquier sitio del mundo. El objetivo es pasar de una imagen satélite puntual a una comprensión temporal del territorio: qué ha pasado, qué patrón subyace, y qué cabe esperar.
Hipsters in USA. Sample over ALABAMA State

Isn’t it incredible? Mapping qualitative data, something as intangible as mapping a concept. For the first time, human behavior and personality in communities can be quantified using artificial intelligence.
Google Earth Engine y los incendios de verano: el caso de Cadalso de los Vidrios, Madrid (Julio 2019)

Gracias a la inestimable ayuda de mi compi de co-working Pablo Martín -ingeniero Forestal- con Google Earth Engine hemos modelado este NBR (Normalized Burn Ratio) que usa los canales NIR y SWIR de Sentinel-2 para medir la severidad del incendio de la semana pasada en mi pueblo, Cadalso de los Vidrios (Madrid, España). Rozamos la tragedia en lo personal pero sin duda fue terrible a nivel material. Tardaremos décadas en revertir este funesto incendio…
Euclidean allocation analysis II

Imagine you need to promote recycling. Imagine you have 1000 inhabitants from a small village and you need to provide proper colored plastic bags for each and every one of the categories you need to disaggregate: organic, plastic and paper. You need to service them all properly but you can only choose 5 shops (out of theContinue reading “Euclidean allocation analysis II”
Allocation analysis: Attaching customers to facilities
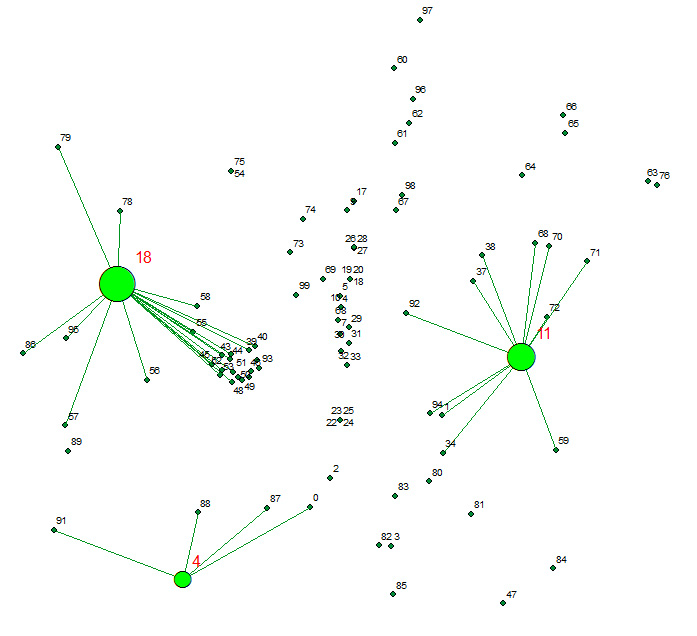
Allocates a set of demand points (Customers) to user specified number of supply points (Facilities) out of a Facilities point dataset based on the Euclidian distance between the Customers and Facilities.
Change detection – Detección de cambios en polígonos
THE PROCEDURE: Centroids of buildings; Spatial join showing presence-absence, considering a 10m accuracy threshold, meaning if the centroid has not moved more than 10m, its the same building. If the centroid in 2012 is not in 2014, its considered as demolished. If a new centroid appears its considered new building.
Pearson correlation and GIS
Do these two variables have a correlation?. To answer this important question first of all we have to know that only if it’s a linear relationship and there are no outliers we can take advantage of Mr Pearson’s correlation statiscal tool. If i love chocolate, does this mean i have tendency of being chuby? orContinue reading “Pearson correlation and GIS”
Remote Sensing, Photogrammetry, Lidar and Landuse IGN Spain
A few more lines for leting you know again that i passed this other course just now in Instituto Geográfico of Spain (IGN). Remote Sensing, Photogrammetry, Lidar and Landuse, a comprehensive 40h update on relevant information i need tu use on a daily basis. This ‘update’ helps me to better understand what i am working with andContinue reading “Remote Sensing, Photogrammetry, Lidar and Landuse IGN Spain”
PISA report SPAIN 2012 by Comunidades Autónomas Trends North-South and West-East
I wanted to take advantage of the latest ‘advanced course on Statistical Analysis’ followed in the spanish IGN and show you how North-South and West-East trends impact on this report. As you can see, the higher the values, the most likely to be in the North and the East of the country. This doesn’t meanContinue reading “PISA report SPAIN 2012 by Comunidades Autónomas Trends North-South and West-East”
