El análisis de la distribución espacial de servicios financieros en centros urbanos —bancos, cajeros, aseguradoras, gestorías y corredurías de seguros— ofrece una lectura directa de la vitalidad económica y la accesibilidad financiera de un territorio. Mapear estos puntos con assetIQ sobre datos Overture Maps permite identificar en minutos dónde se concentra la actividad financiera, qué zonas quedan en la periferia del servicio y cómo se estructuran los ejes comerciales de cada ciudad. El mismo análisis es replicable para cualquier otra capa temática —alojamiento, salud, restauración, deporte— convirtiendo cada capital de provincia en un dashboard geoespacial comparable y reproducible.
Category Archives: geomarketing
SolarScope: cuando el catastro, el LiDAR y el sol se sientan a la misma mesa
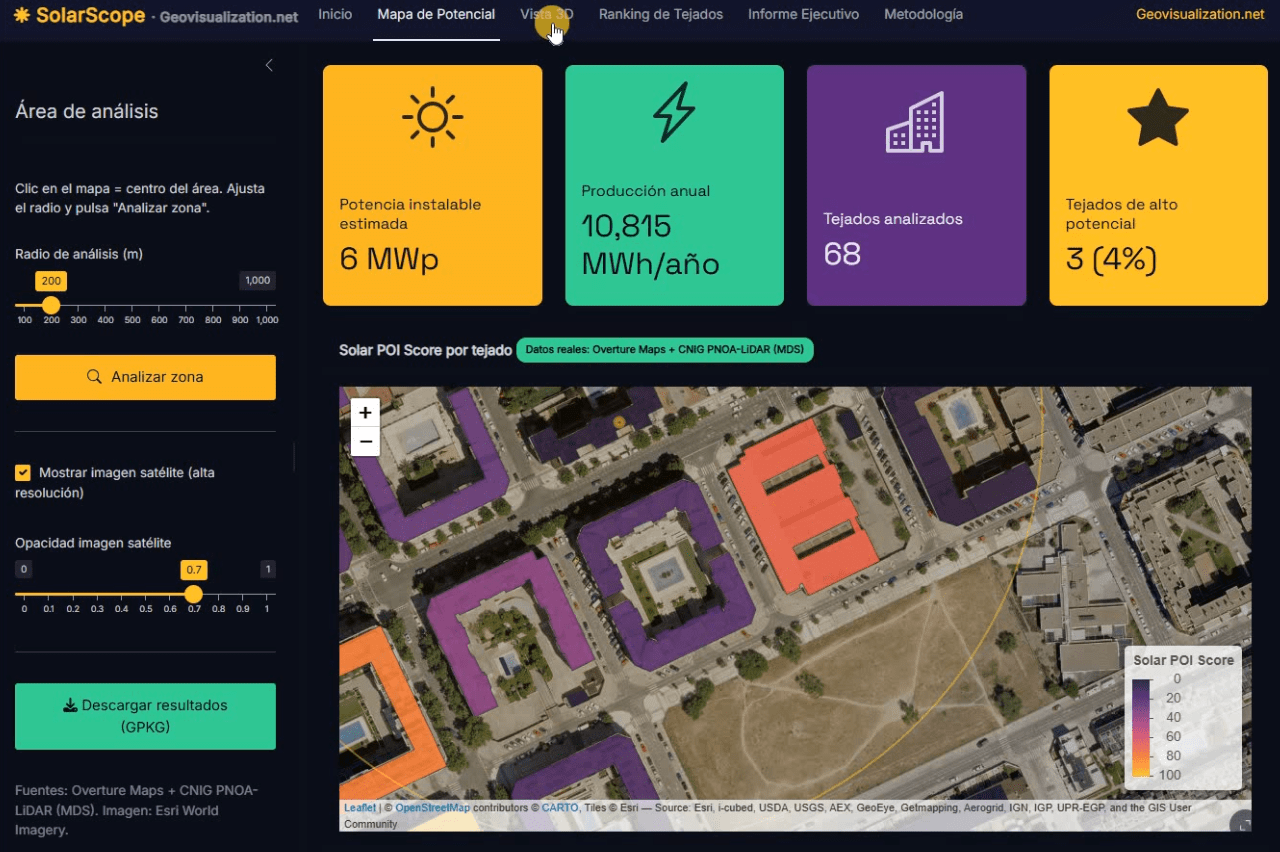
Llevo unos días dándole vueltas a una idea que, en el fondo, es bastante sencilla: si tenemos la huella de cada edificio, su altura y un modelo digital de superficies de alta resolución, ¿por qué seguimos viendo estudios de potencial solar que tratan los tejados como manchas homogéneas sobre un mapa? De esa pregunta, y de unas cuantas sesiones intensas de R, ha salido SolarScope, una aplicación Shiny que estoy desarrollando para hacer scoring de potencial fotovoltaico tejado a tejado, con datos abiertos y un flujo que se puede reproducir tanto en España como en Estados Unidos.
POI Intelligence for Urban Asset Analysis in RStudio: assetIQ
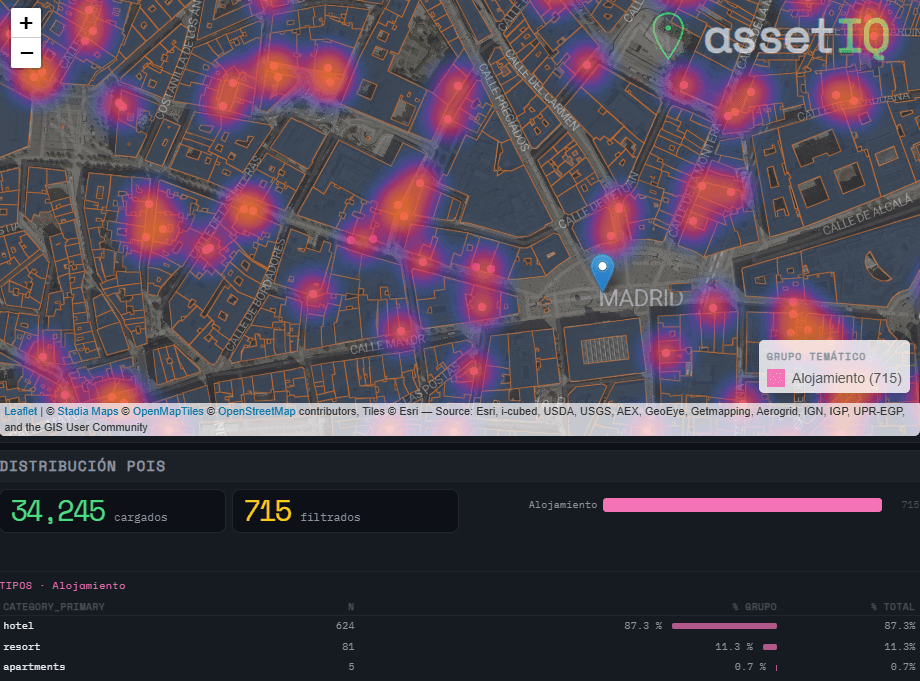
When analysing urban assets, there is genuine value in moving beyond generic neighborhood scores. The density of a coffee shop cluster, the proximity to a financial hub, or the concentration of accommodation around a transport node are signals that traditional datasets flatten into averages — or ignore entirely. assetIQ was built to change that. assetIQ is an R application powered by DuckDB and Overture Maps that extracts, classifies, and scores Points of Interest (POIs) for any location on Earth. You define a city and a search radius — from 100 meters to 25 kilometers — and the tool queries the Overture Maps Places dataset in real time, classifying each POI into thematic groups: Food & Drink, Retail, Health, Education, Transport, Accommodation, Financial Services, Leisure & Culture, Sport, and more.
The core output is an attribute value called POIQ: a normalized 0–1 score assigned to every building footprint within the area of interest, derived from a Kernel Density Estimation of the selected thematic group. A building in a dense retail corridor scores close to 1. An isolated residential block far from any commerce scores close to 0. This transforms thousands of individual points — which in raw form tell you very little — into a single, interpretable attribute per building, ready for downstream modelling, valuation, or site selection.
Detecting Potential Mobile Coverage Gaps Using OpenCellID, GHSL and Overture Maps: Case study over TUNIS
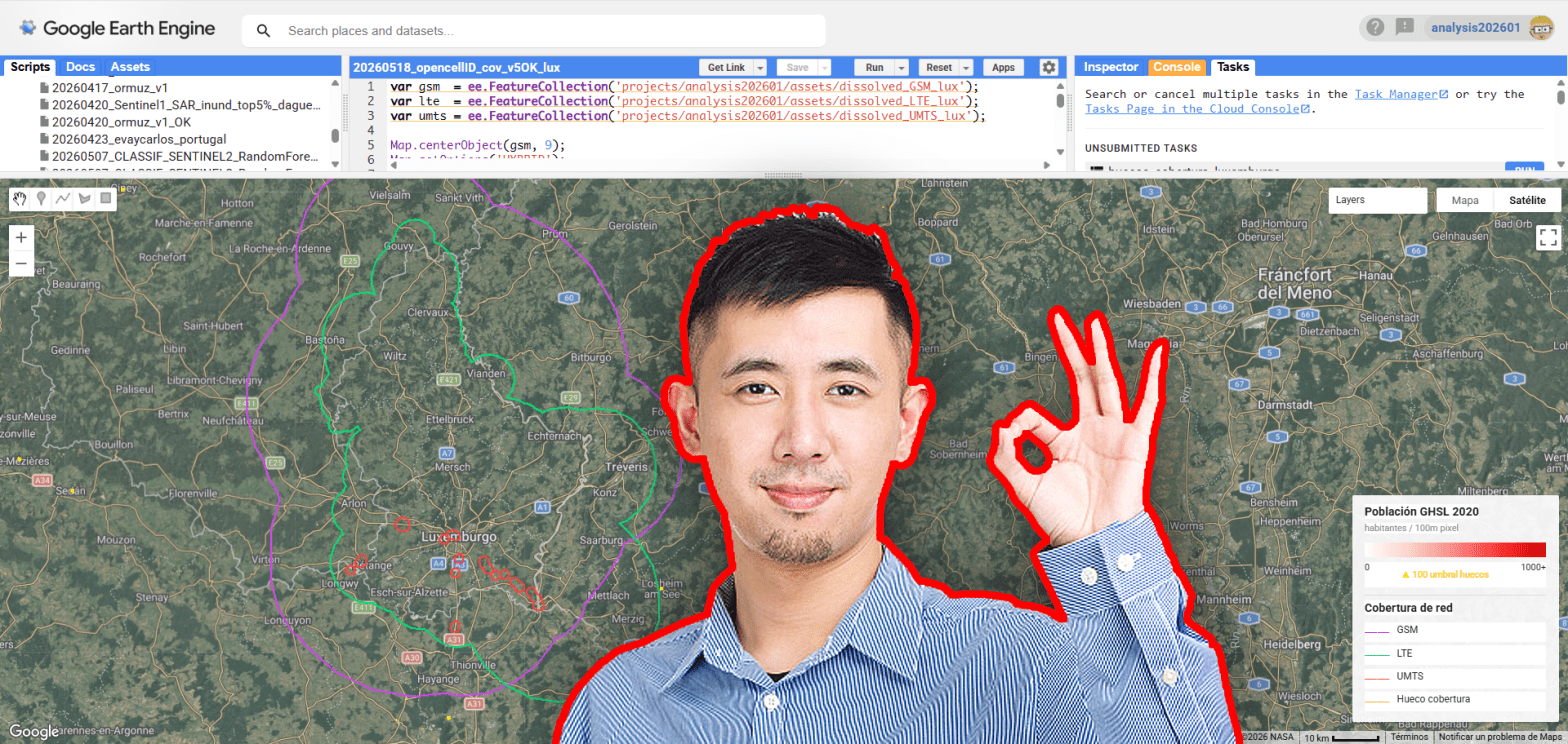
Mobile connectivity has become a fundamental component of modern infrastructure, yet significant spatial inequalities in network access still persist across both urban peripheries and rural environments. Using openly available geospatial datasets, this analysis explores potential mobile coverage gaps by combining OpenCellID cellular infrastructure observations, GHSL population layers and vector data extracted from Overture Maps. The objective is not to reproduce real telecom propagation models, but to generate a simplified spatial estimation of coverage capable of identifying populated areas potentially located outside the influence of nearby cellular infrastructure.
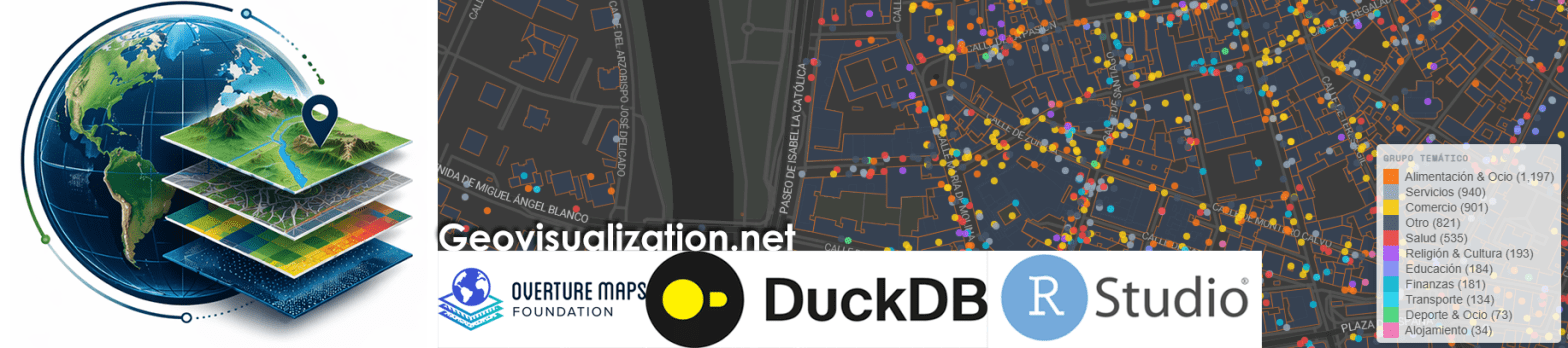
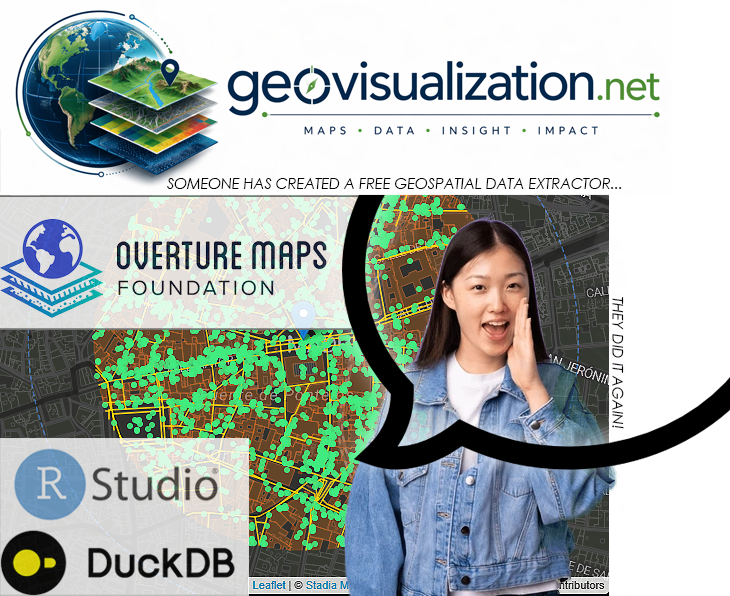
From Overture Maps to GPKG in minutes: Building a Geospatial Data Extractor with R and DuckDB
Modern geospatial workflows increasingly depend on fast, reliable access to city-scale vector data — building footprints, road networks, land use polygons, points of interest, address databases. Whether you are designing a 5G radio network, modelling urban heat islands, planning last-mile logistics, or simulating emergency response coverage, you almost always start from the same question: “How do I get clean, structured geodata for this city, right now, without spending two days on it?”
The Overture Maps Extractor is my answer to that question. It is a Shiny application written in R that lets any GIS professional extract multiple thematic layers from the Overture Maps Foundation dataset — for any city in the world — in a matter of minutes, with zero command-line interaction and zero manual data wrangling.
Urban development in Madrid from the mid-19th century to the present day

All existing buildings in Madrid currently listed in the Land Registry database have their year of construction recorded. This map shows, by decade, where the bulk of that urban development took place. For example, in the 1920s it was in the Salamanca district, in the 1930s in Chamartín… shifting from development in the city centre to the outskirts.
Population Estimation through Dynamic LULC-Based Settlement Validation
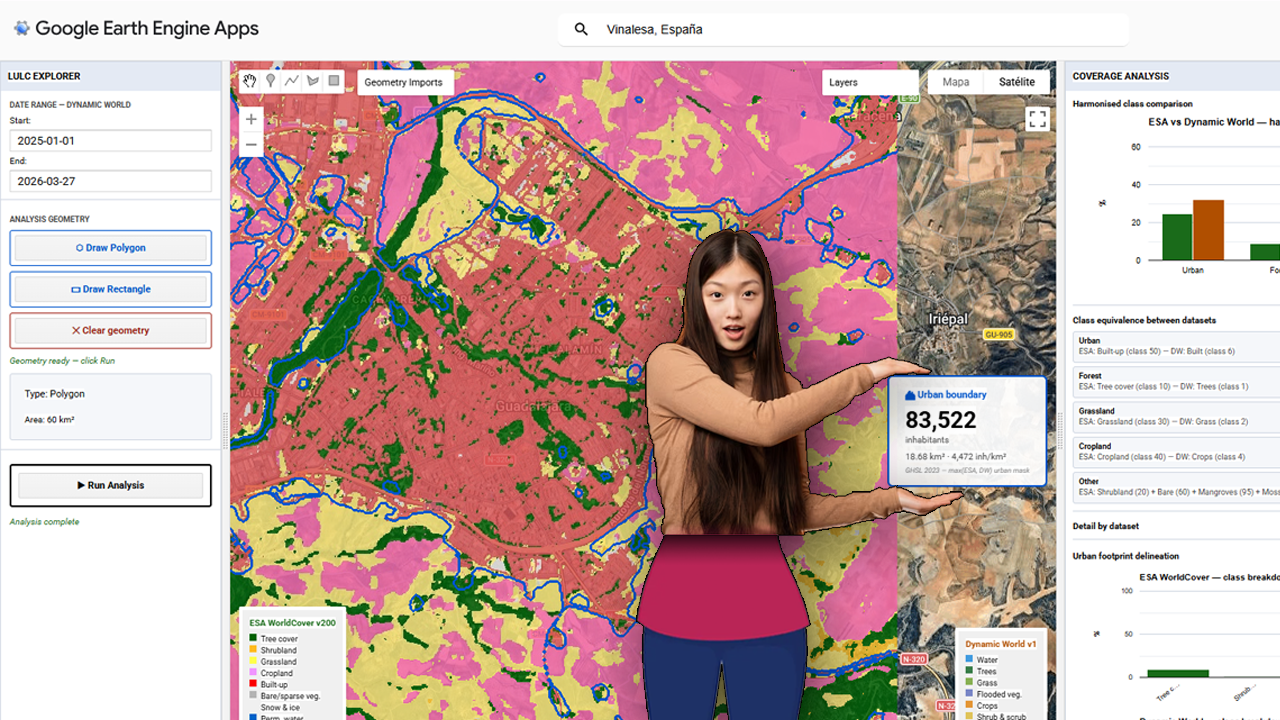
The foundational step of this methodology involves the deployment of a centralized processing interface within the Google Earth Engine (GEE) environment. The provided visualization captures the core interface of the custom GEE application, which serves as the hub for the multi-sensor LULC validation pipeline. Within this dashboard, users can define a specific Area of Interest (AOI)—highlighted here over the Iberian Peninsula and North Africa—and configure key parameters, including temporal ranges for the acquisition of sentinel-derived products. Crucially, the interface is designed to load and compare two primary datasets simultaneously: Dynamic World (near real-time, probability-based LULC) and ESA WorldCover (10m resolution structured LULC). The contrasting classification schemes are represented by the legends on the left and right sides of the map view, which illustrate the varying definitions of ‘Built-up’ and urban areas between the two products. Establishing this visual and statistical comparison at the application level is the prerequisite for calculating the spatial disagreement threshold, or delta, that guides the subsequent merging and population estimation phases.
Aventuras y desventuras de un geógrafo en “desarrollo”
La cartografía siempre ha sido un oficio de precisión, paciencia y criterio espacial. Durante años, el flujo de trabajo de cualquier geógrafo pasaba inevitablemente por entornos de escritorio como ArcGIS Pro o QGIS: cargar capas, ajustar simbología, exportar mapas. Herramientas sólidas, probadas, indispensables. Pero algo está cambiando.
Cada vez más, el análisis espacial ocurre en la nube, en navegadores, en entornos de código. En anteriores post habéis visto algunos test/ideas/aplicaciones que he desarrollado con Javascript Google Earth Engine, que procesa imágenes satelitales a escala planetaria sin mover un solo archivo. Deck.gl y Maplibre renderizan millones de puntos en 3D directamente en el navegador. React convierte un mapa en una aplicación interactiva con pocas líneas de código.
ESTIMATED GHSL vs INE 2025
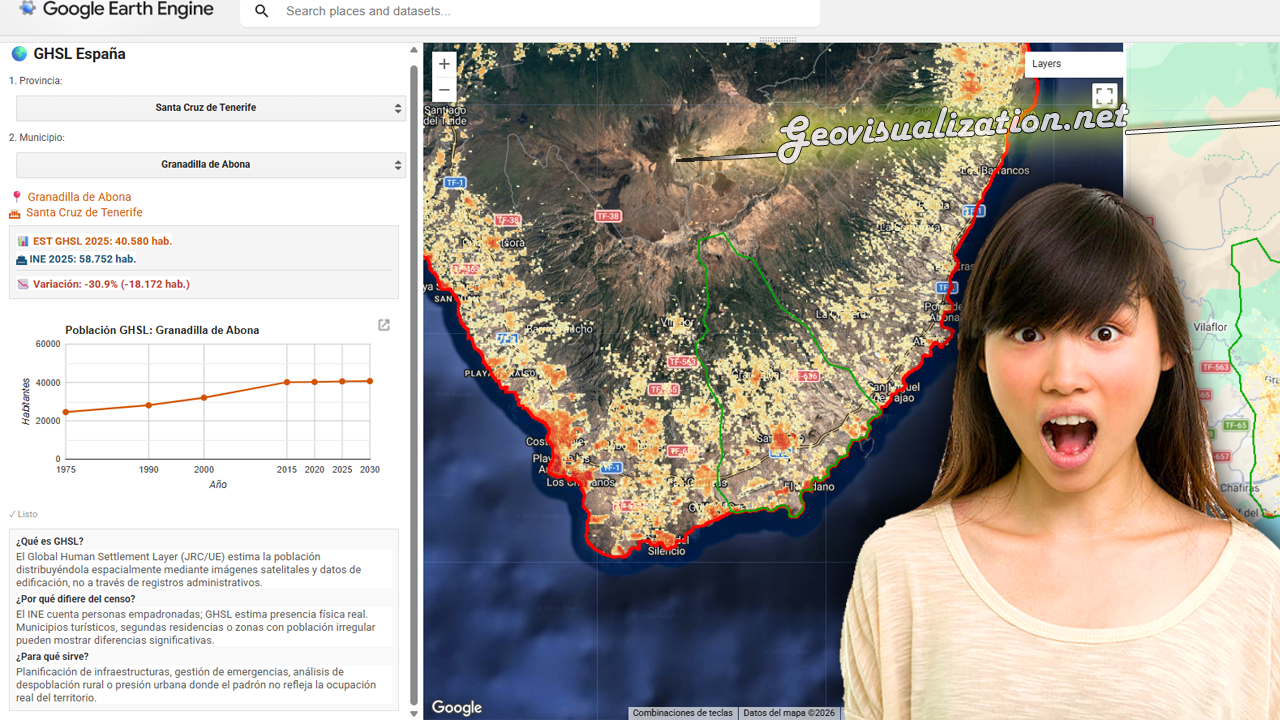
He desarrollado este COMPARADOR DE POBLACIÓN GHSL vs PADRÓN INE 2025 en JavaScript/Google Earth Engine que cruza estimaciones satelitales de población con los datos oficiales del censo español municipio a municipio.
La herramienta permite seleccionar cualquier provincia y municipio de España, visualizar la distribución espacial de población estimada por el GHSL con el último dato oficial del INE 2025, detectando municipios con alta presión turística, despoblación real o población no registrada.
Una aplicación directa para planificación de infraestructuras, gestión de emergencias o análisis de cohesión territorial donde el padrón no refleja la ocupación real del territorio.
¡Con R de running!
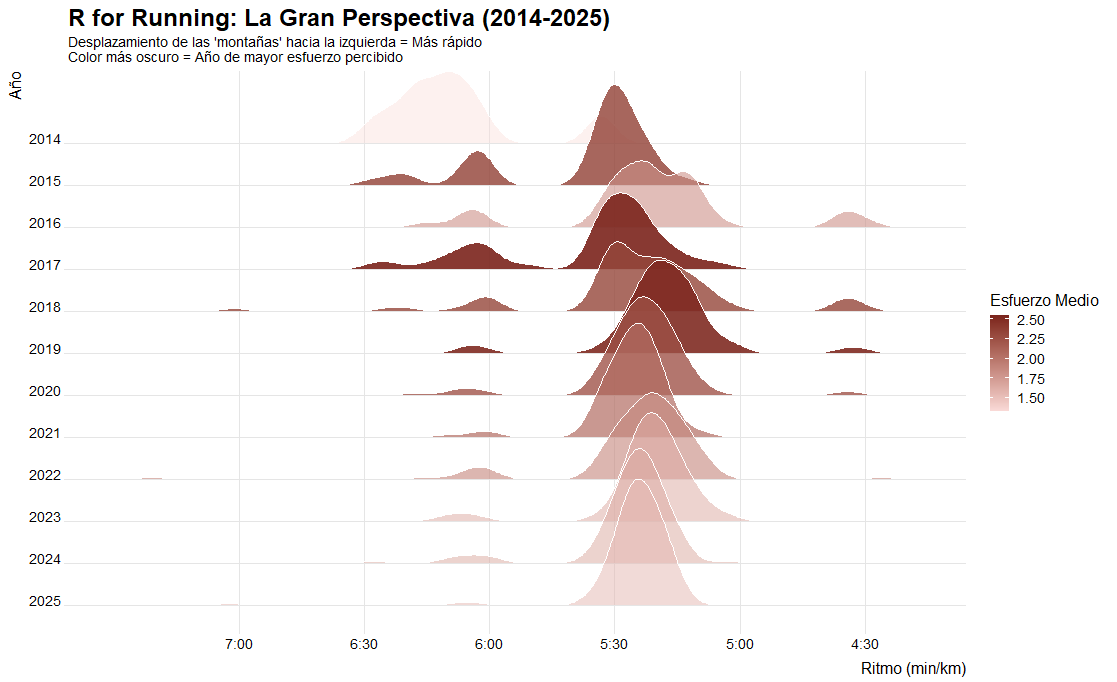
Un registro constante: más de 11 años (desde Agosto 2014 hasta hoy) con más de 1,150 sesiones documentadas. Un proyecto vital; no son solo números, es la cronología de mi disciplina. Puedo decir de nuevo que R me ha roto mis esquemas de geógrafo de ArcGIS, de Global Mapper y QGIS, ahora no todo pasa por el filtro de tener coordenadas, por ejemplo estos insights no tienen coordenadas pero son analizables y se pueden tomar conclusiones que te permiten tomar decisiones rápidas… Echemos un vistazo a mis carreras los últimos años.
