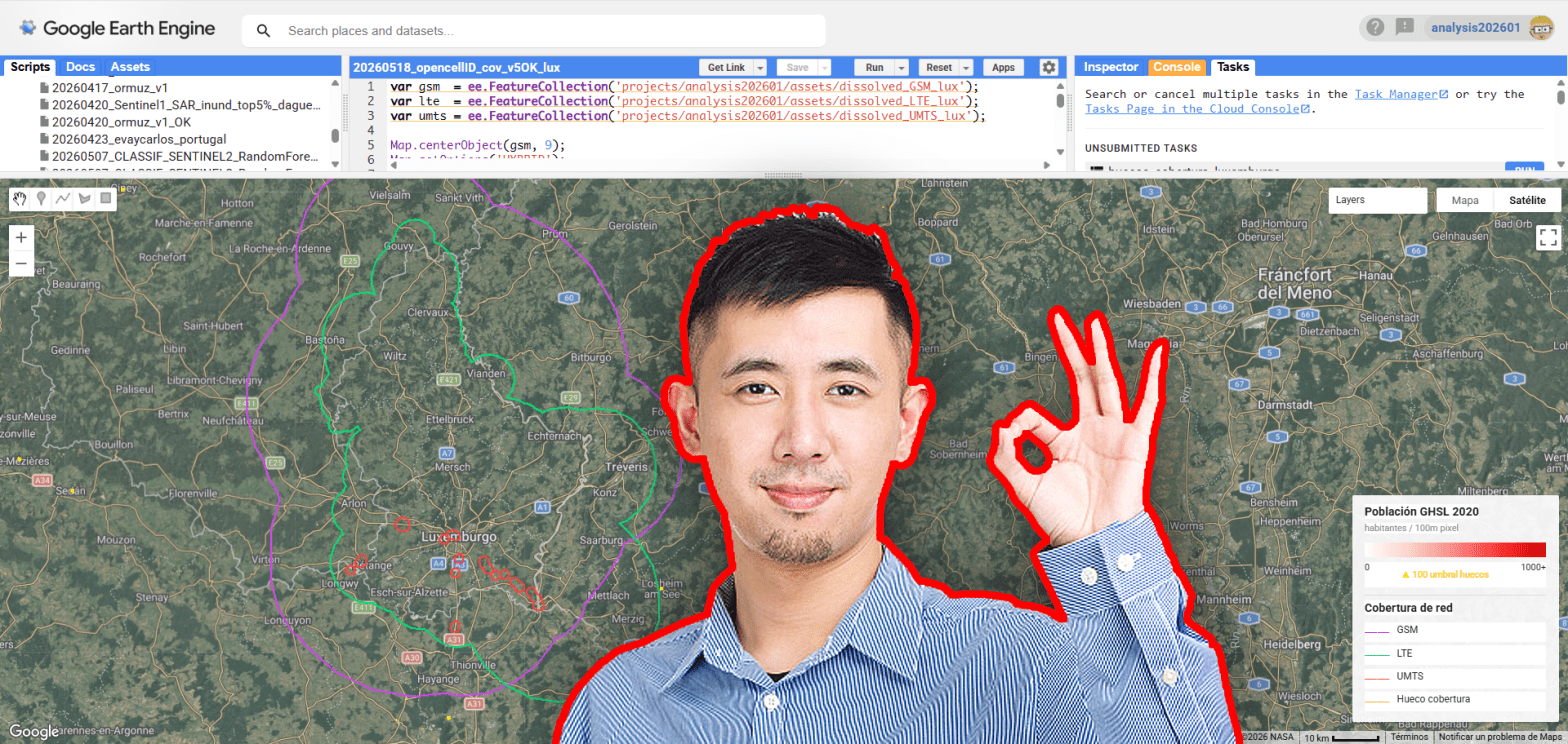
Mobile connectivity has become a fundamental component of modern infrastructure, yet significant spatial inequalities in network access still persist across both urban peripheries and rural environments. Using openly available geospatial datasets, this analysis explores potential mobile coverage gaps by combining OpenCellID cellular infrastructure observations, GHSL population layers and vector data extracted from Overture Maps. The objective is not to reproduce real telecom propagation models, but to generate a simplified spatial estimation of coverage capable of identifying populated areas potentially located outside the influence of nearby cellular infrastructure.
Category Archives: population
Bienvenido a Madrid Río, donde el carril único lo usa todo el mundo… pero solo la mitad lo usa bien
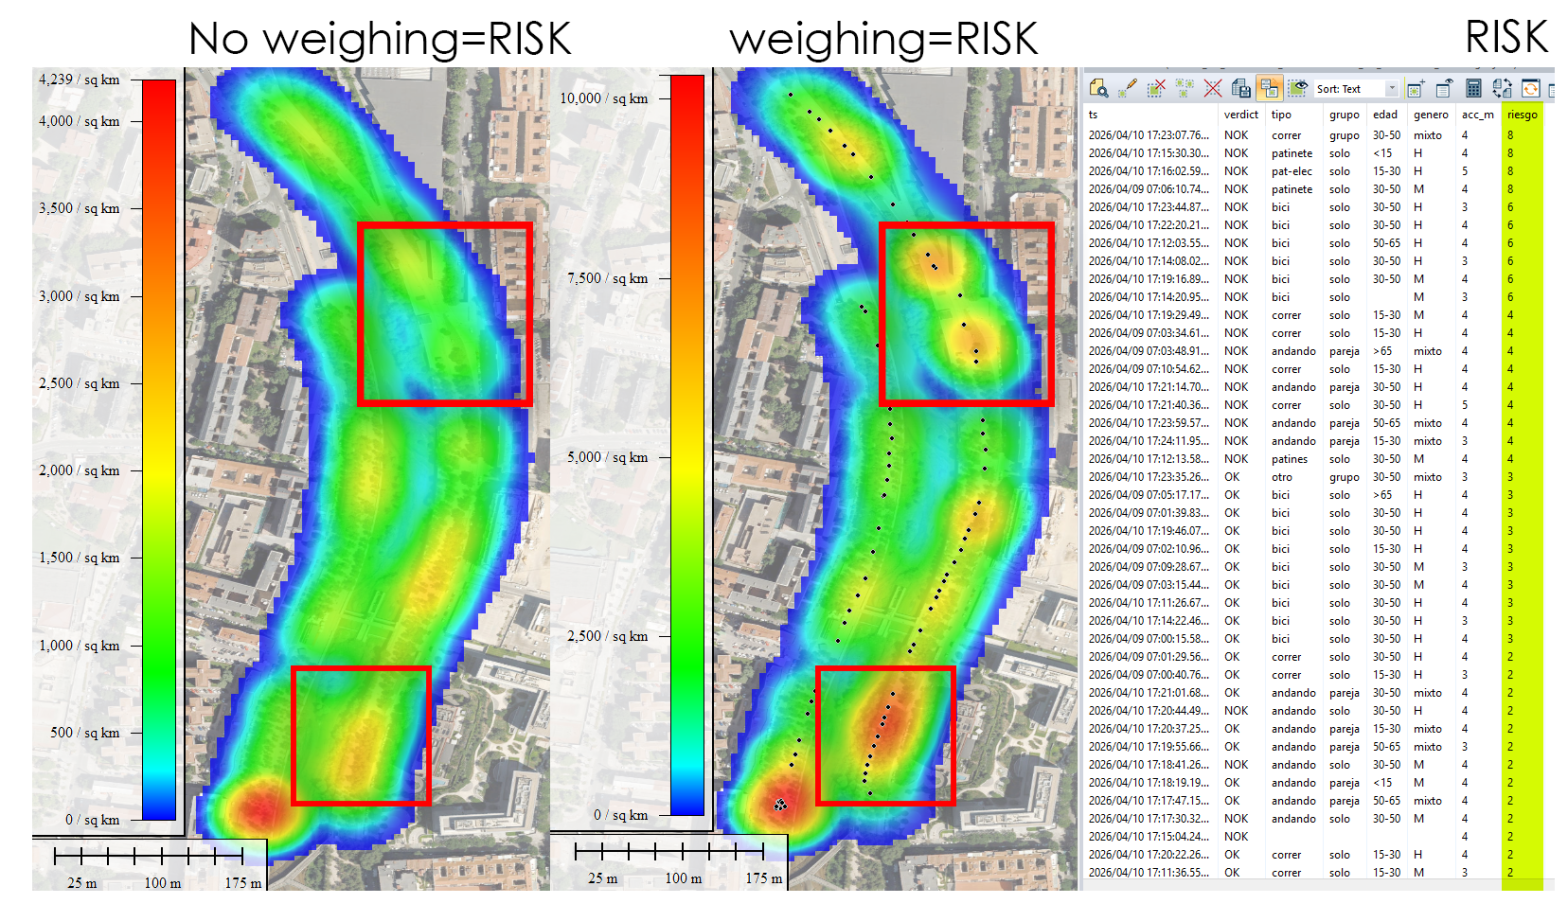
Y cuando eso ocurre, se genera un caos silencioso. Normalmente se resuelve en segundos con ese equilibrio dinámico tan mediterráneo que tenemos —un quiebro, una mirada, un gesto— pero no siempre. He visto bicis arrollar a personas que iban por su lado. Grupos andando en paralelo, bloqueando la vía entera. Patinetes a velocidad de vértigo a punto de llevarse por delante a un niño que, irónicamente, iba exactamente donde debía. Yo mismo llevo usando esta vía desde casi su inauguración, hace más de once años, y puedo decir que el problema no ha mejorado: ha crecido, a medida que el carril se ha llenado de nuevas tipologías de movilidad.
¿Qué quiero hacer? Quiero medir esto. Con rigor, con datos, y con herramientas actuales. Mi objetivo es retratar estadísticamente quién va en el sentido correcto y quién no, desagregando por tipo de movilidad, edad, género y comportamiento en grupo. ¿Son los ciclistas los que más incumplen, o los patinetes eléctricos? ¿La gente mayor es más respetuosa que los jóvenes? ¿Los grupos de tres o más personas son el mayor factor de caos? No lo sé aún. Pero lo voy a descubrir.
Population Estimation through Dynamic LULC-Based Settlement Validation
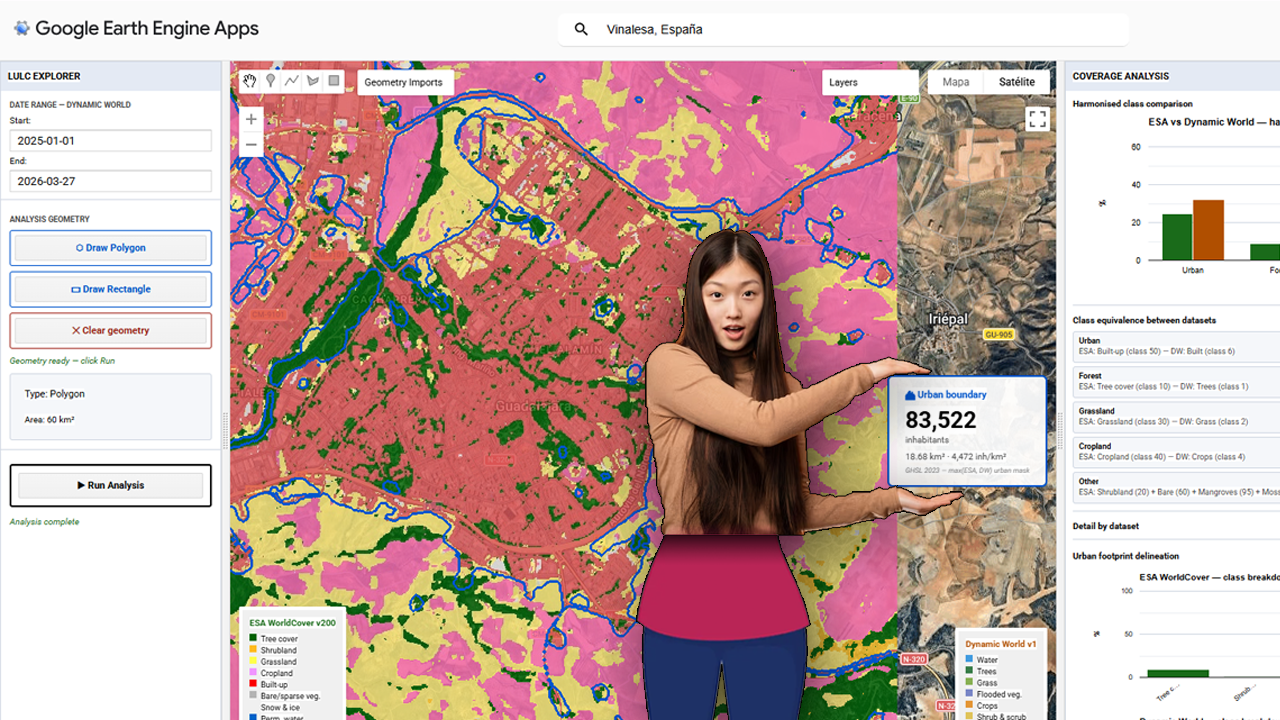
The foundational step of this methodology involves the deployment of a centralized processing interface within the Google Earth Engine (GEE) environment. The provided visualization captures the core interface of the custom GEE application, which serves as the hub for the multi-sensor LULC validation pipeline. Within this dashboard, users can define a specific Area of Interest (AOI)—highlighted here over the Iberian Peninsula and North Africa—and configure key parameters, including temporal ranges for the acquisition of sentinel-derived products. Crucially, the interface is designed to load and compare two primary datasets simultaneously: Dynamic World (near real-time, probability-based LULC) and ESA WorldCover (10m resolution structured LULC). The contrasting classification schemes are represented by the legends on the left and right sides of the map view, which illustrate the varying definitions of ‘Built-up’ and urban areas between the two products. Establishing this visual and statistical comparison at the application level is the prerequisite for calculating the spatial disagreement threshold, or delta, that guides the subsequent merging and population estimation phases.
Aventuras y desventuras de un geógrafo en “desarrollo”
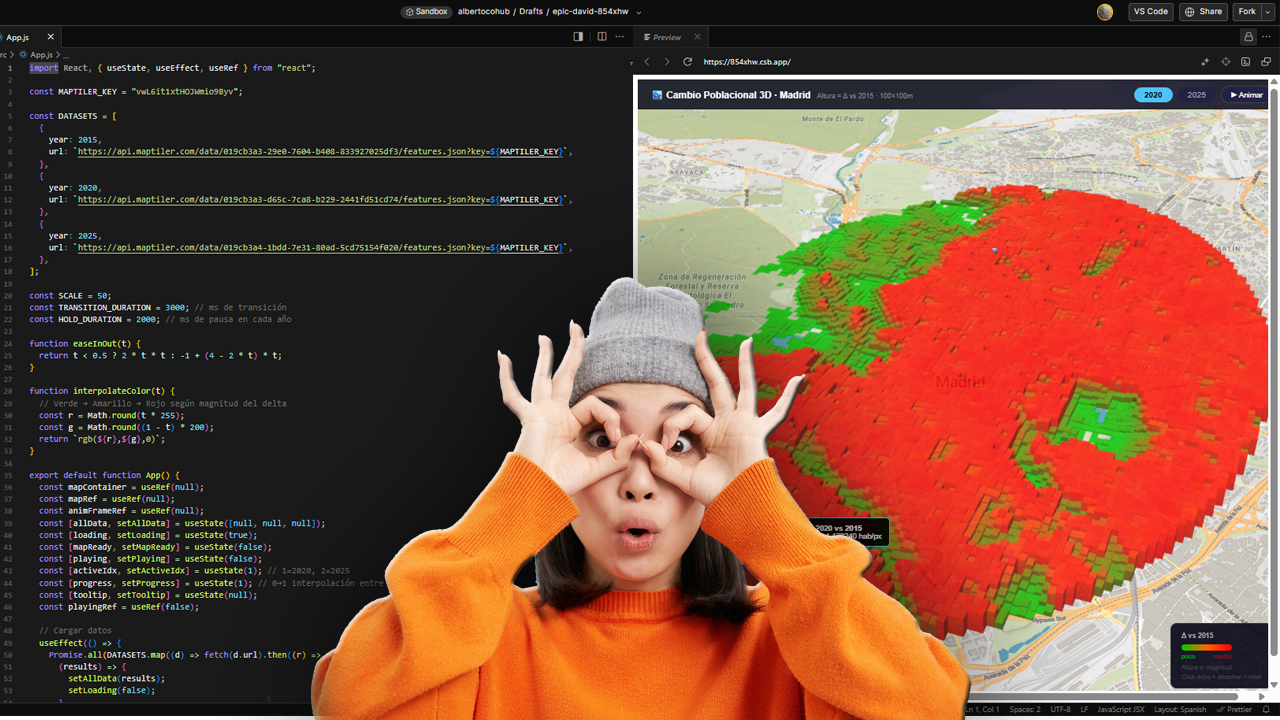
La cartografía siempre ha sido un oficio de precisión, paciencia y criterio espacial. Durante años, el flujo de trabajo de cualquier geógrafo pasaba inevitablemente por entornos de escritorio como ArcGIS Pro o QGIS: cargar capas, ajustar simbología, exportar mapas. Herramientas sólidas, probadas, indispensables. Pero algo está cambiando.
Cada vez más, el análisis espacial ocurre en la nube, en navegadores, en entornos de código. En anteriores post habéis visto algunos test/ideas/aplicaciones que he desarrollado con Javascript Google Earth Engine, que procesa imágenes satelitales a escala planetaria sin mover un solo archivo. Deck.gl y Maplibre renderizan millones de puntos en 3D directamente en el navegador. React convierte un mapa en una aplicación interactiva con pocas líneas de código.
Flood assessment using RADAR (Sentinel1), SRTM v3+ and GHSL pop estimation
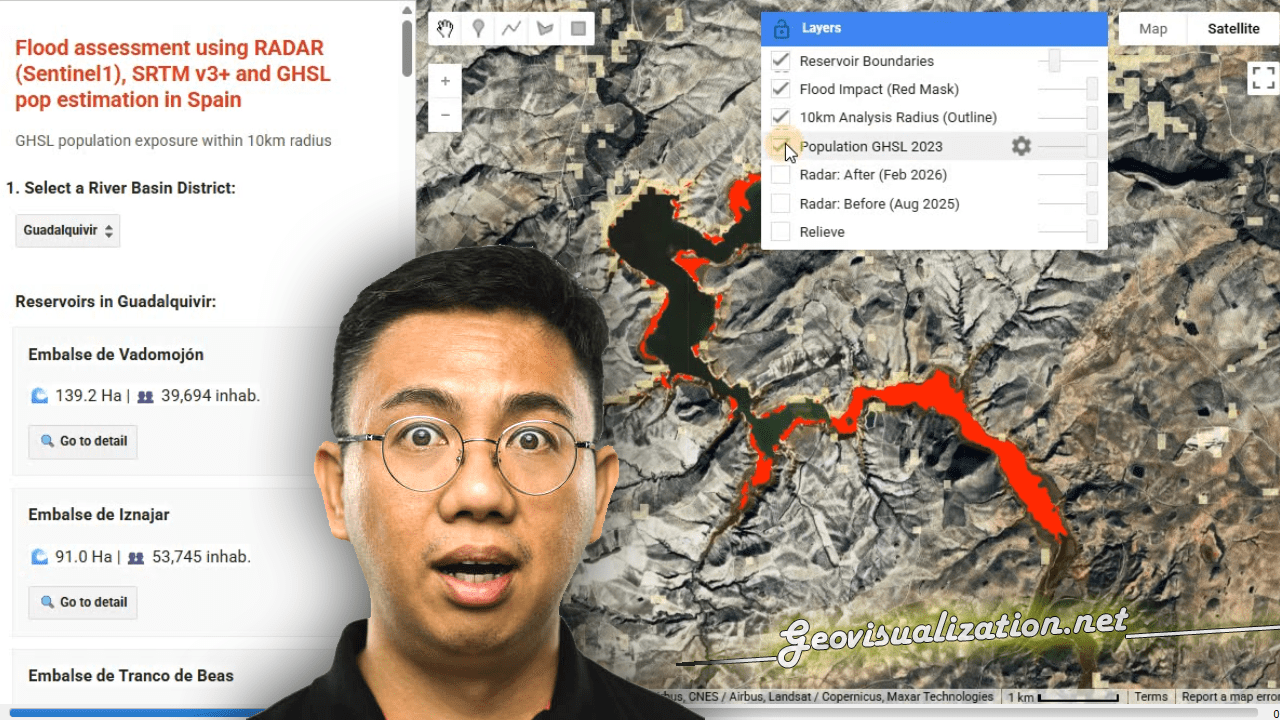
I have developed this NRT FLOOD RISK ASSESSMENT monitor in GEE that merges the power of RADAR and GHSL to detect impact over POPULATIONS under any weather conditions.
You can use geospatial intelligence to quickly transform satellite data into critical decisions during climate emergencies. GIS technology driving global resilience!
