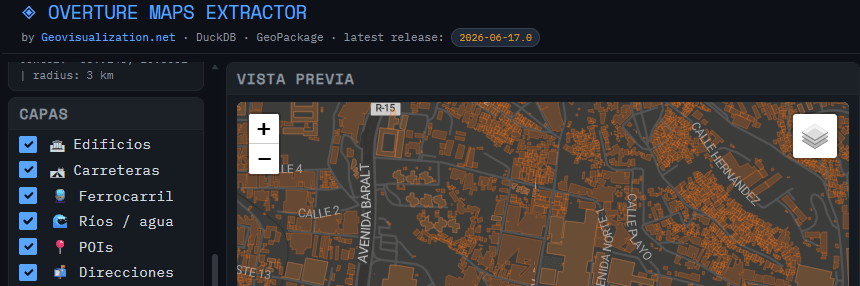
Just wanted to update on the usage of the tool I developed (OVERTURE MAPS EXTRACTOR) for extraction of Open data from Overture Maps for a quick hands on.
Category Archives: urbanisimo
SolarScope: cuando el catastro, el LiDAR y el sol se sientan a la misma mesa
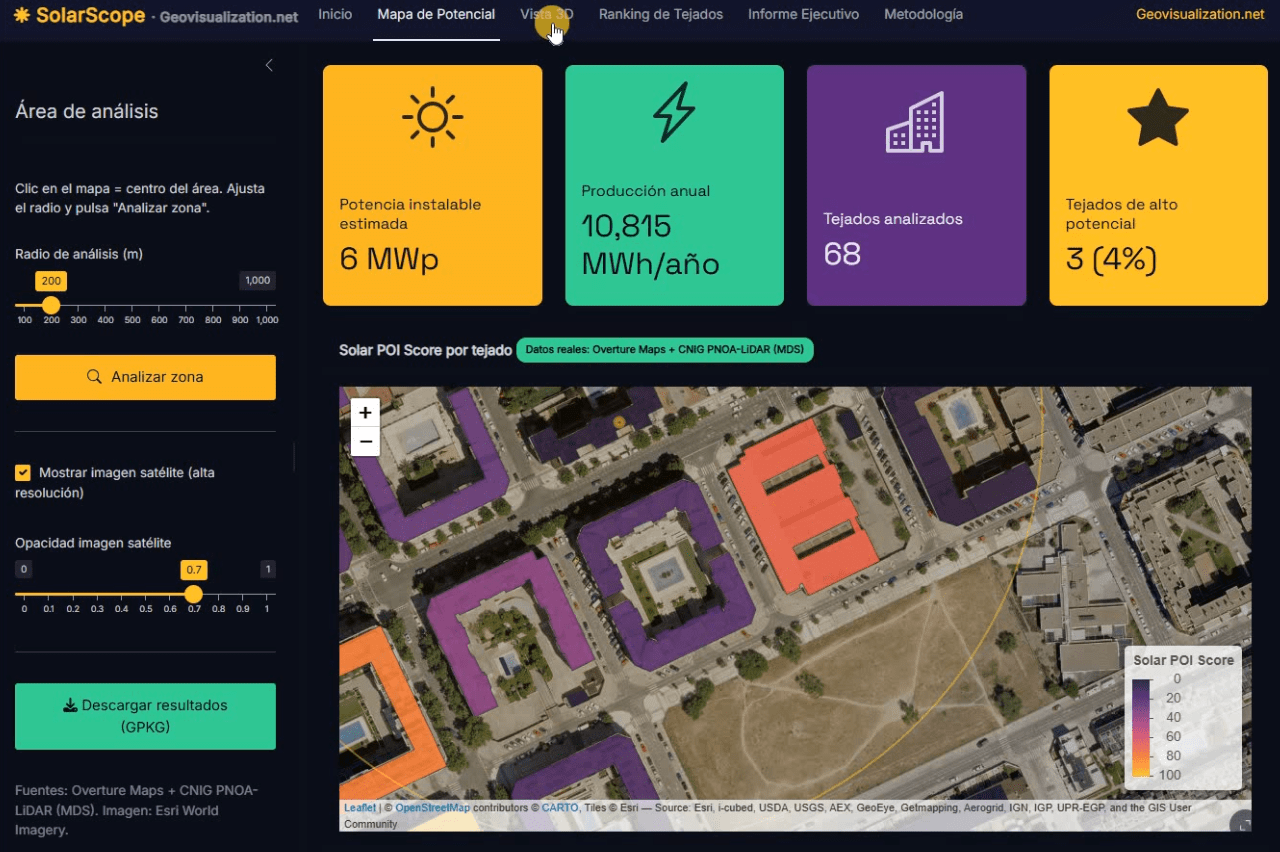
Llevo unos días dándole vueltas a una idea que, en el fondo, es bastante sencilla: si tenemos la huella de cada edificio, su altura y un modelo digital de superficies de alta resolución, ¿por qué seguimos viendo estudios de potencial solar que tratan los tejados como manchas homogéneas sobre un mapa? De esa pregunta, y de unas cuantas sesiones intensas de R, ha salido SolarScope, una aplicación Shiny que estoy desarrollando para hacer scoring de potencial fotovoltaico tejado a tejado, con datos abiertos y un flujo que se puede reproducir tanto en España como en Estados Unidos.
POI Intelligence for Urban Asset Analysis in RStudio: assetIQ
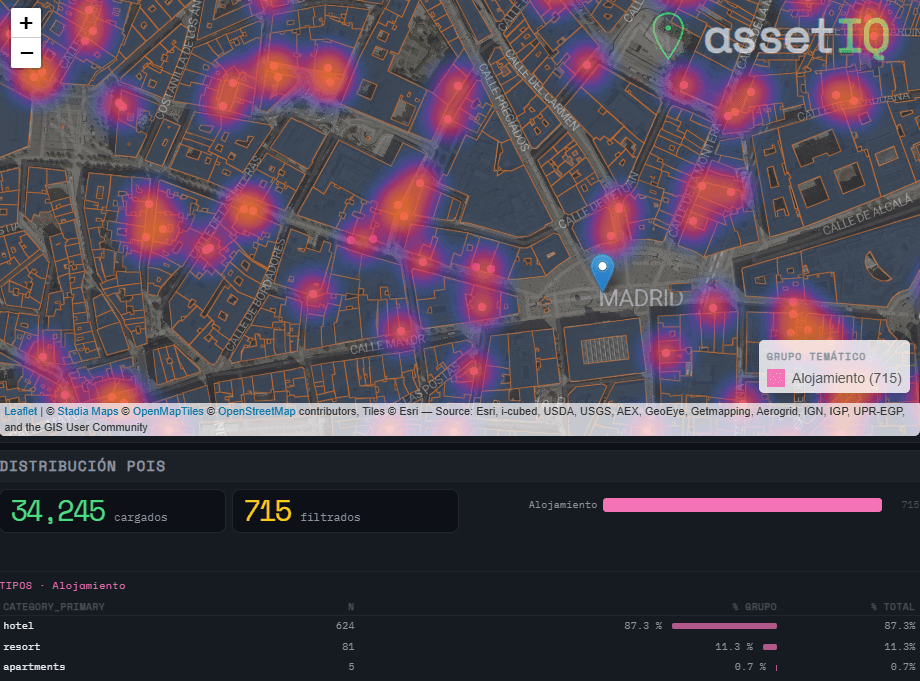
When analysing urban assets, there is genuine value in moving beyond generic neighborhood scores. The density of a coffee shop cluster, the proximity to a financial hub, or the concentration of accommodation around a transport node are signals that traditional datasets flatten into averages — or ignore entirely. assetIQ was built to change that. assetIQ is an R application powered by DuckDB and Overture Maps that extracts, classifies, and scores Points of Interest (POIs) for any location on Earth. You define a city and a search radius — from 100 meters to 25 kilometers — and the tool queries the Overture Maps Places dataset in real time, classifying each POI into thematic groups: Food & Drink, Retail, Health, Education, Transport, Accommodation, Financial Services, Leisure & Culture, Sport, and more.
The core output is an attribute value called POIQ: a normalized 0–1 score assigned to every building footprint within the area of interest, derived from a Kernel Density Estimation of the selected thematic group. A building in a dense retail corridor scores close to 1. An isolated residential block far from any commerce scores close to 0. This transforms thousands of individual points — which in raw form tell you very little — into a single, interpretable attribute per building, ready for downstream modelling, valuation, or site selection.
Urban development in Madrid from the mid-19th century to the present day

All existing buildings in Madrid currently listed in the Land Registry database have their year of construction recorded. This map shows, by decade, where the bulk of that urban development took place. For example, in the 1920s it was in the Salamanca district, in the 1930s in Chamartín… shifting from development in the city centre to the outskirts.
Bienvenido a Madrid Río, donde el carril único lo usa todo el mundo… pero solo la mitad lo usa bien
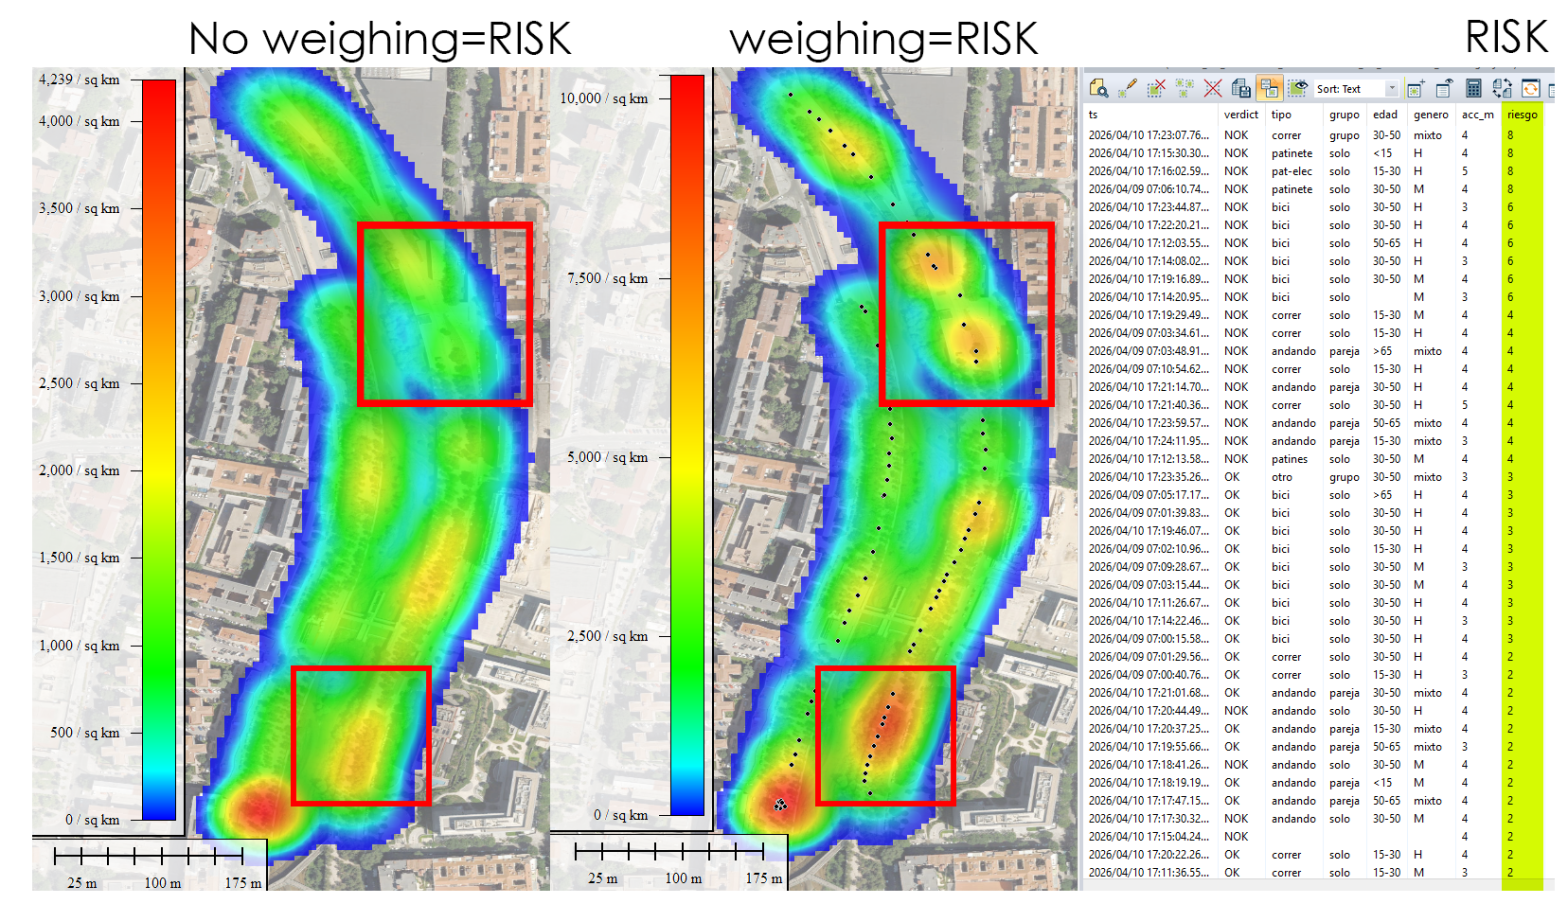
Y cuando eso ocurre, se genera un caos silencioso. Normalmente se resuelve en segundos con ese equilibrio dinámico tan mediterráneo que tenemos —un quiebro, una mirada, un gesto— pero no siempre. He visto bicis arrollar a personas que iban por su lado. Grupos andando en paralelo, bloqueando la vía entera. Patinetes a velocidad de vértigo a punto de llevarse por delante a un niño que, irónicamente, iba exactamente donde debía. Yo mismo llevo usando esta vía desde casi su inauguración, hace más de once años, y puedo decir que el problema no ha mejorado: ha crecido, a medida que el carril se ha llenado de nuevas tipologías de movilidad.
¿Qué quiero hacer? Quiero medir esto. Con rigor, con datos, y con herramientas actuales. Mi objetivo es retratar estadísticamente quién va en el sentido correcto y quién no, desagregando por tipo de movilidad, edad, género y comportamiento en grupo. ¿Son los ciclistas los que más incumplen, o los patinetes eléctricos? ¿La gente mayor es más respetuosa que los jóvenes? ¿Los grupos de tres o más personas son el mayor factor de caos? No lo sé aún. Pero lo voy a descubrir.
Aventuras y desventuras de un geógrafo en “desarrollo”
La cartografía siempre ha sido un oficio de precisión, paciencia y criterio espacial. Durante años, el flujo de trabajo de cualquier geógrafo pasaba inevitablemente por entornos de escritorio como ArcGIS Pro o QGIS: cargar capas, ajustar simbología, exportar mapas. Herramientas sólidas, probadas, indispensables. Pero algo está cambiando.
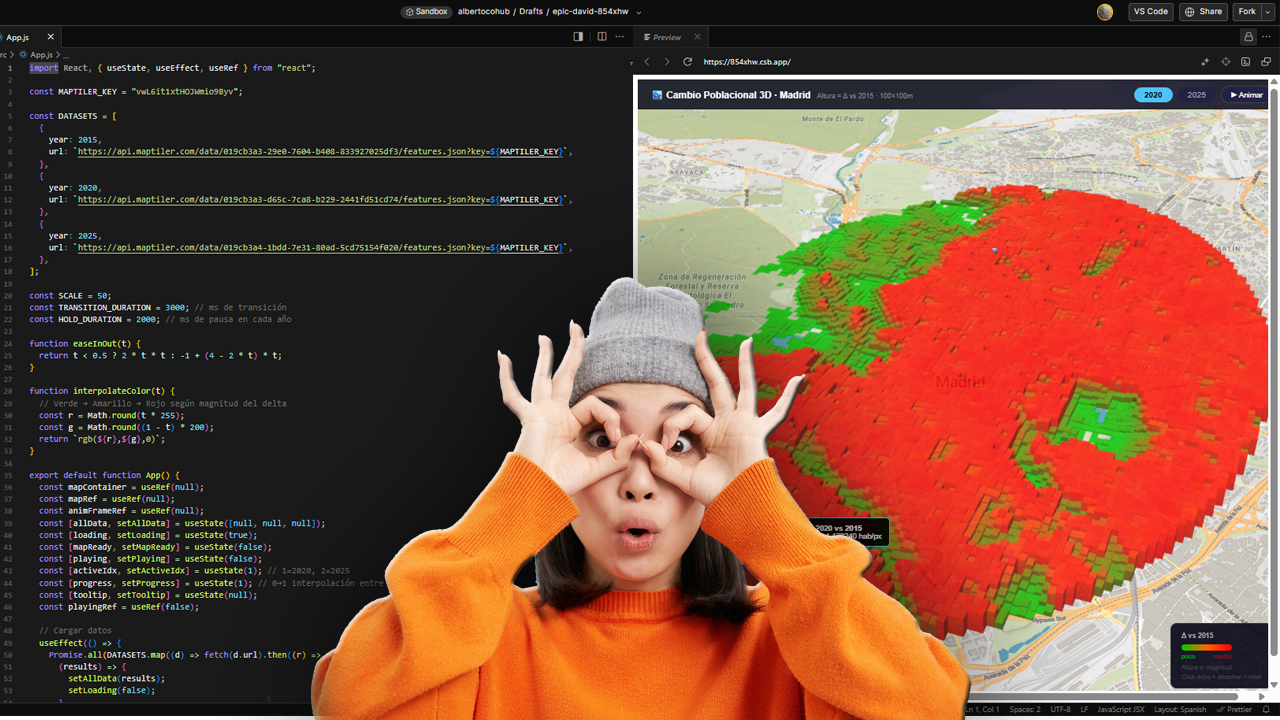
Cada vez más, el análisis espacial ocurre en la nube, en navegadores, en entornos de código. En anteriores post habéis visto algunos test/ideas/aplicaciones que he desarrollado con Javascript Google Earth Engine, que procesa imágenes satelitales a escala planetaria sin mover un solo archivo. Deck.gl y Maplibre renderizan millones de puntos en 3D directamente en el navegador. React convierte un mapa en una aplicación interactiva con pocas líneas de código.
ESTIMATED GHSL vs INE 2025
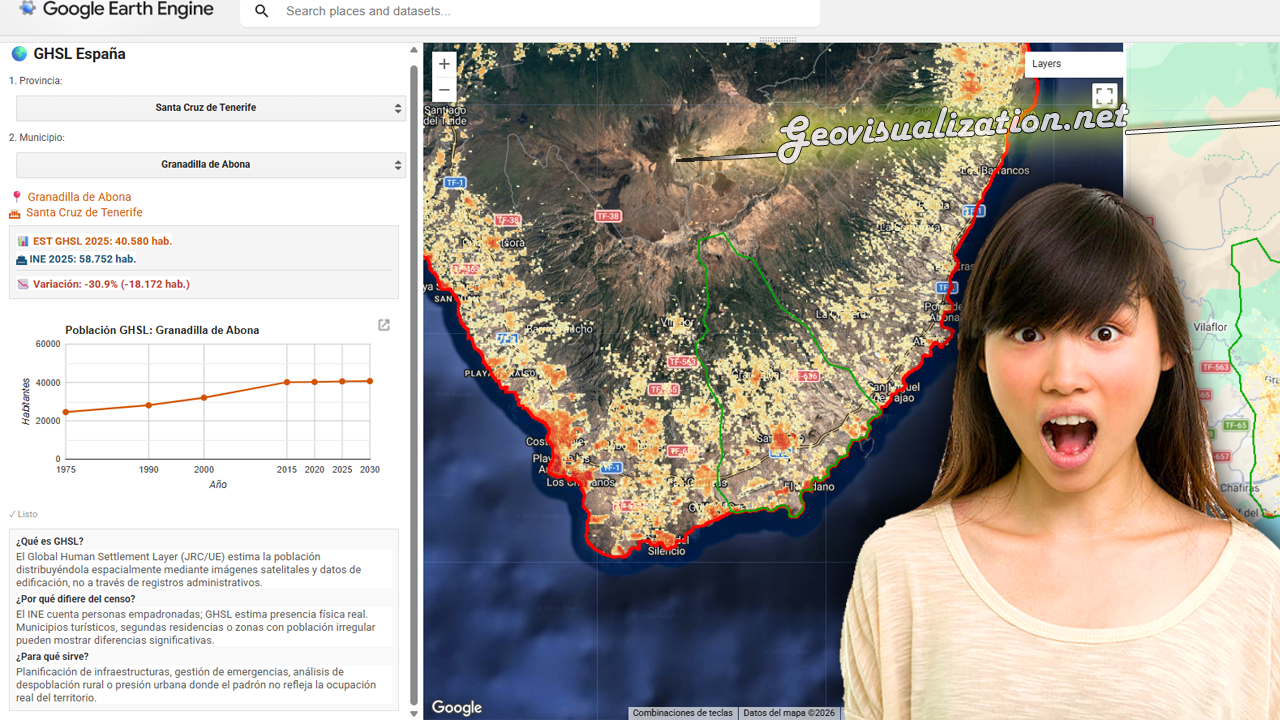
He desarrollado este COMPARADOR DE POBLACIÓN GHSL vs PADRÓN INE 2025 en JavaScript/Google Earth Engine que cruza estimaciones satelitales de población con los datos oficiales del censo español municipio a municipio.
La herramienta permite seleccionar cualquier provincia y municipio de España, visualizar la distribución espacial de población estimada por el GHSL con el último dato oficial del INE 2025, detectando municipios con alta presión turística, despoblación real o población no registrada.
Una aplicación directa para planificación de infraestructuras, gestión de emergencias o análisis de cohesión territorial donde el padrón no refleja la ocupación real del territorio.
R analysis for HR corporate talent management
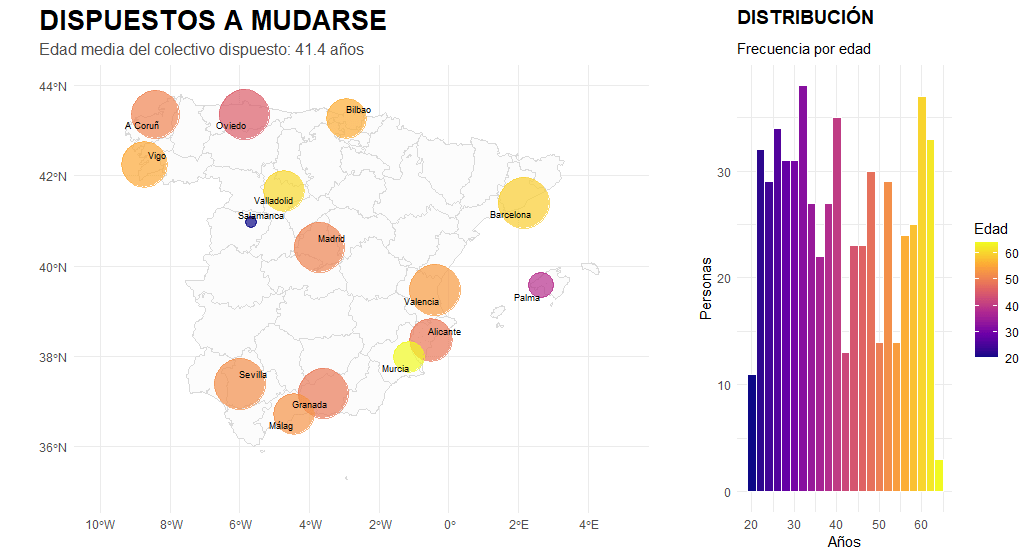
I am a geographer by training, and my professional career has always had a predominantly geospatial focus. Having recently completed a forty-hour course in R, using RStudio and GitHub, I feel that a whole new world of analysis has opened up before me. This work represents the meeting point between my basic geographical instinct and the technical capabilities of statistical programming. It is important to emphasise that I have invented this data and model entirely, so the results have no real meaning and contain inevitable biases. Their sole purpose is to learn and demonstrate the capabilities of this language. I believe that geographical knowledge and code are interdependent, as one without the other would not function successfully. It is precisely this symbiosis that I hope will make a difference in my current job search.
URBAN ATLAS 2018 + WORLDPOP 100m/GHSL 100m estimates over Madrid
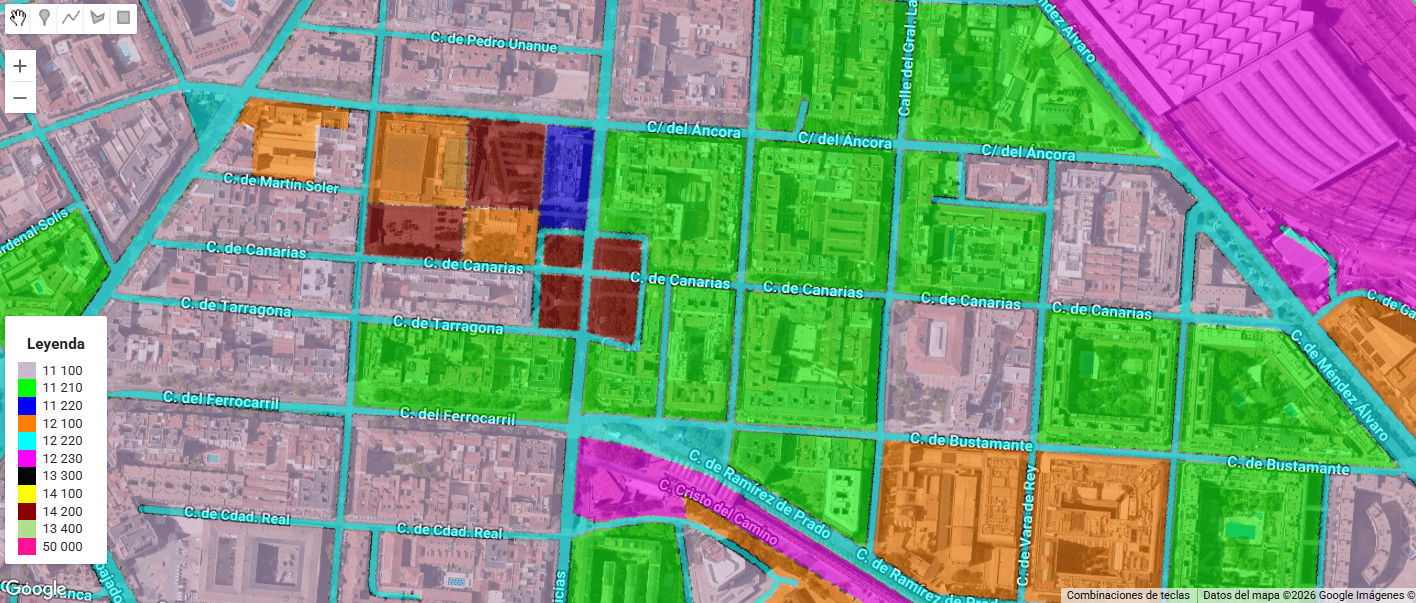
Urban Atlas (UA) representa el estándar de oro dentro del Copernicus Land Monitoring Service (CLMS) para el análisis de la morfología urbana en Europa. A diferencia de Corine Land Cover, UA ofrece una resolución temática y espacial drásticamente superior (Unidad Mínima de Mapeo de 0.25 ha para clases urbanas), permitiendo discriminar entre tejidos urbanos continuos y discontinuos con una precisión de densidad del 10% al 80%.
Analyzing Spatial Correlation between Purchase Power Index and Gambling Stores (2)

This GIS study applies Geographically Weighted Regression (GWR) to investigate the spatial relationship between Purchasing Power Index (PPI) and the distribution of gambling-related retail establishments within the city of Madrid. My aim is to account for spatially varying relationships driven by local urban contexts, under the assumption that the relationship between socioeconomic conditions and the presence of gambling venues varies across urban space. My hypothesis is that the socioeconomic conditions of the urban fabric can be a breeding ground for the location of betting shops, or in other words, I am attempting to Detect Urban Vulnerability to Gambling Harm.
