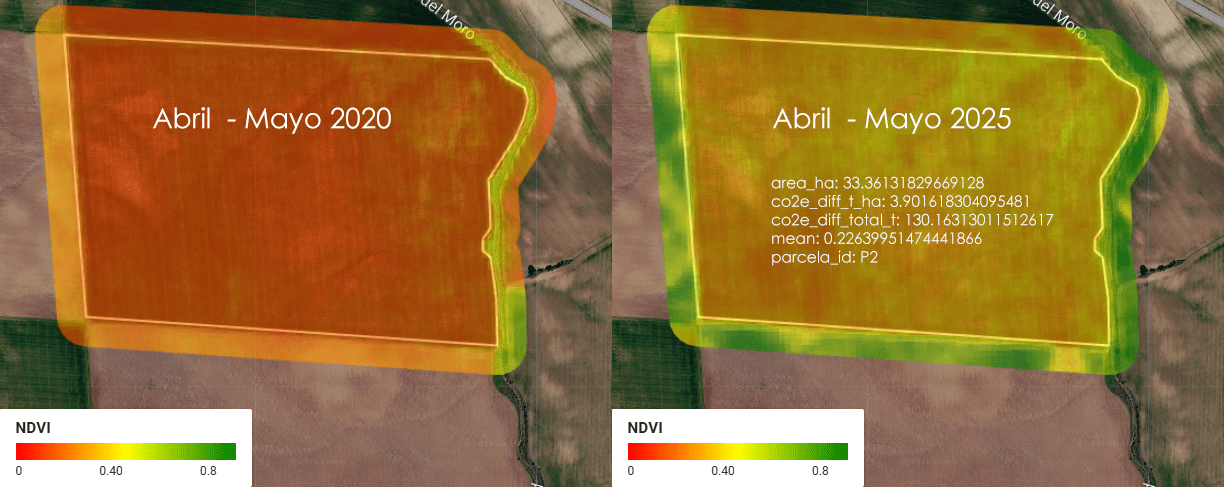
Imagina una empresa que se llama ACME. ACME es dueña de 5 parcelas de tierra en Almendralejo, Extremadura, España, donde se cultiva cereal (trigo, cebada, ese tipo de cosas). Entre las 5 parcelas, ACME tiene un total de 1.52 km² de tierra — para que te hagas una idea, eso es más o menos el tamaño de 300 campos de fútbol (a rzón de aproximadamente media hectárea por cada campo).
Category Archives: remote sensing
KALMAN RADAR TRACKER: SEGUIMIENTO DE BLANCOS AÉREOS
Cuando alguien me pregunta sobre radar, pienso sobre todo en radares montados en satélites (sesgo geospacial) pero en realidad hay mucho más, hoy voy a hablaros de de radares aeroportados, de filtros de Kalman y seguimiento de blancos aéreos en movimiento… ¡Qué interesante!
Lo primero que pienso no es en el radar en sí, sino en el problema que resuelve, porque ese problema lo llevo resolviendo de otra forma desde hace años sin llamarlo por su nombre técnico. Un radar mide la posición de un avión con ruido. Un GPS mide la posición de un coche con ruido. Un sensor SAR mide el desplazamiento del terreno con ruido. En los tres casos hay una señal real escondida detrás de mediciones que saltan, que tiemblan, que nunca coinciden exactamente con la trayectoria verdadera. Y en los tres casos la respuesta es la misma matemática: combinar lo que predice el modelo físico con lo que dice el sensor, ponderando cada fuente según cuánto te fías de ella.
Time Series Analyzer: Análisis multitemporal de índices espectrales en Google Earth Engine
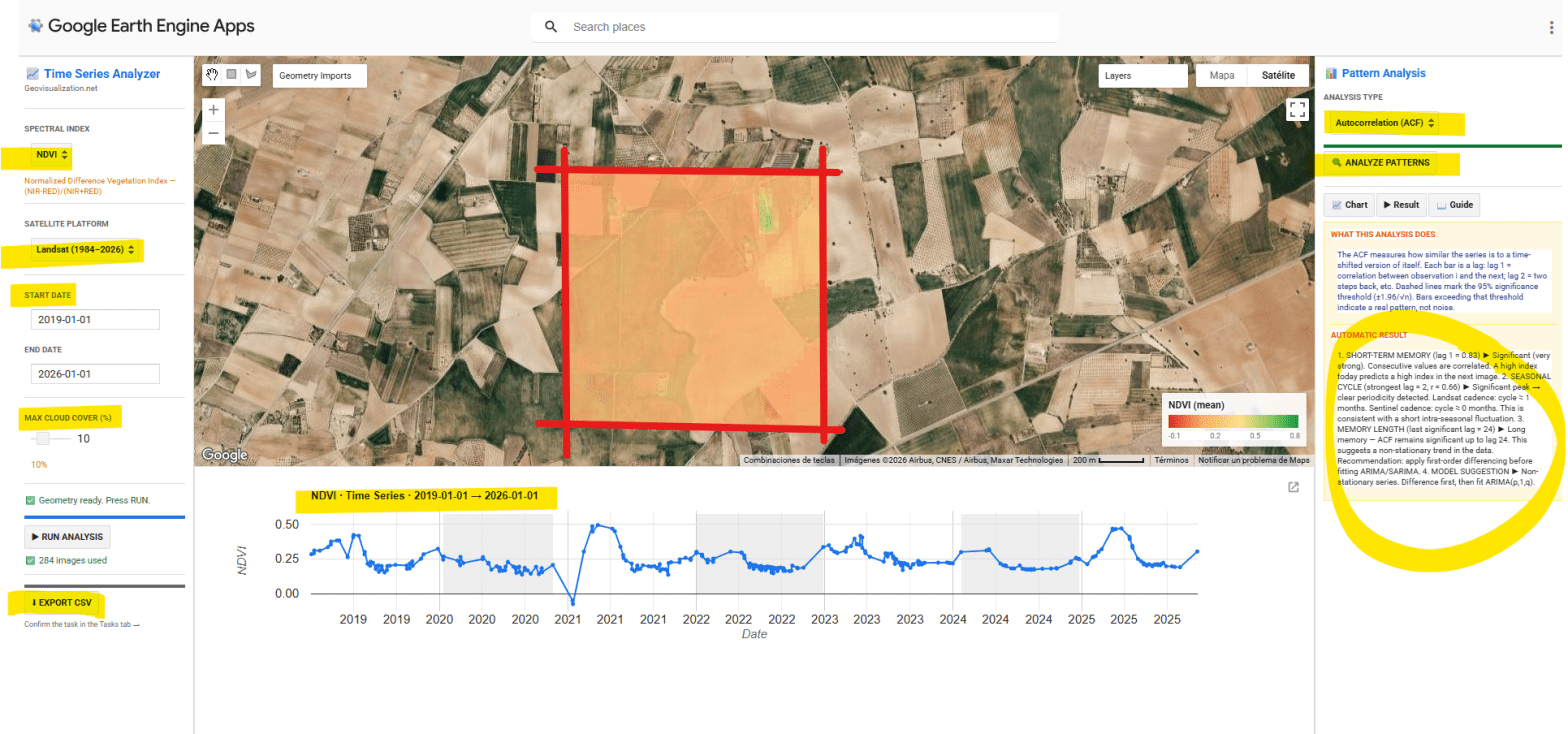
He desarrollado una aplicación interactiva en Google Earth Engine para la extracción y análisis estadístico automático de series temporales de cinco índices espectrales (NDVI, EVI, SAVI, NDWI y NBR) sobre cualquier geometría definida por el usuario en cualquier sitio del mundo. El objetivo es pasar de una imagen satélite puntual a una comprensión temporal del territorio: qué ha pasado, qué patrón subyace, y qué cabe esperar.
Mapterhorn + R: LOS analysis in seconds! 🚀

The analysis of LOS (Line of Sight) in telecommunications is the study that determines whether a clear, unobstructed path exists between a transmitting antenna and a receiver. While this calculation was traditionally reserved for large microwave links over long distances or in rural environments, the arrival of 5G networks and the horizon of 6G have turned it into an absolute priority for urban deployment, completely transforming how networks are planned in major cities.
CHANGE DETECTION ARCGIS PRO AND LIVING ATLAS 2017-2025
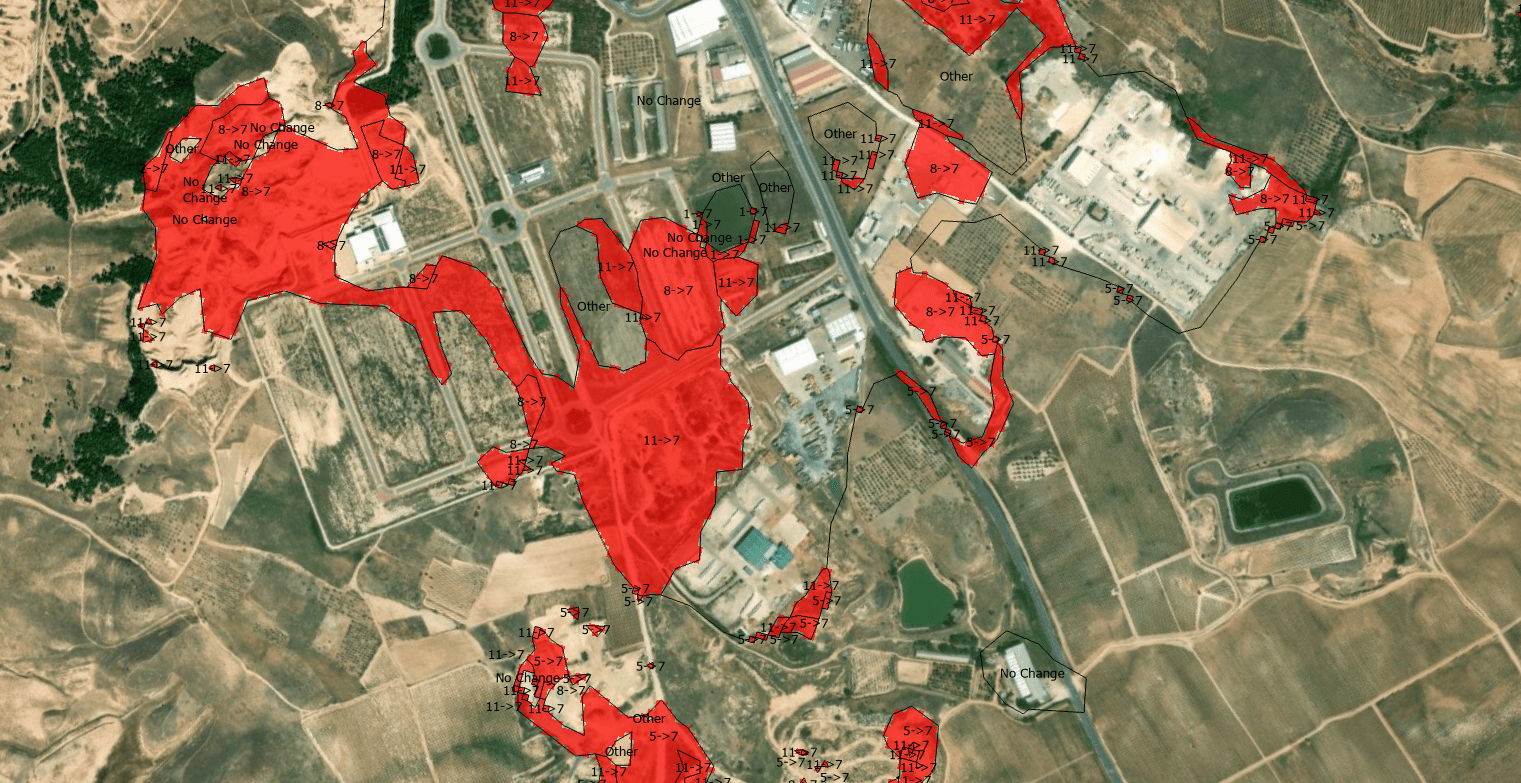
The quantification of land-use dynamics necessitates a spatiotemporal framework that ensures categorical stability over long-term observation windows. The ESRI 10-Meter Global Land Cover time series, accessible through the ArcGIS Living Atlas, provides a harmonized baseline for this purpose, derived from the dense temporal stack of the ESA Sentinel-2 mission.
Who Gets to See the War? Satellite Imagery Censorship and the Copernicus Alternative
A private company, operating under a US federal license, was effectively told by the Trump administration to go dark over an active war zone. Planet complied. Vantor and BlackSky — both heavily dependent on US defense revenue — said they hadn’t even received such a request, because they were already tightly controlling access. The selective pressure lands precisely on the most open, most commercially accessible provider. That is not a coincidence.A private company, operating under a US federal license, was effectively told by the Trump administration to go dark over an active war zone. Planet complied. Vantor and BlackSky — both heavily dependent on US defense revenue — said they hadn’t even received such a request, because they were already tightly controlling access. The selective pressure lands precisely on the most open, most commercially accessible provider. That is not a coincidence.
Agricultura de precisión (II). APP para integración con Catastro rural en España
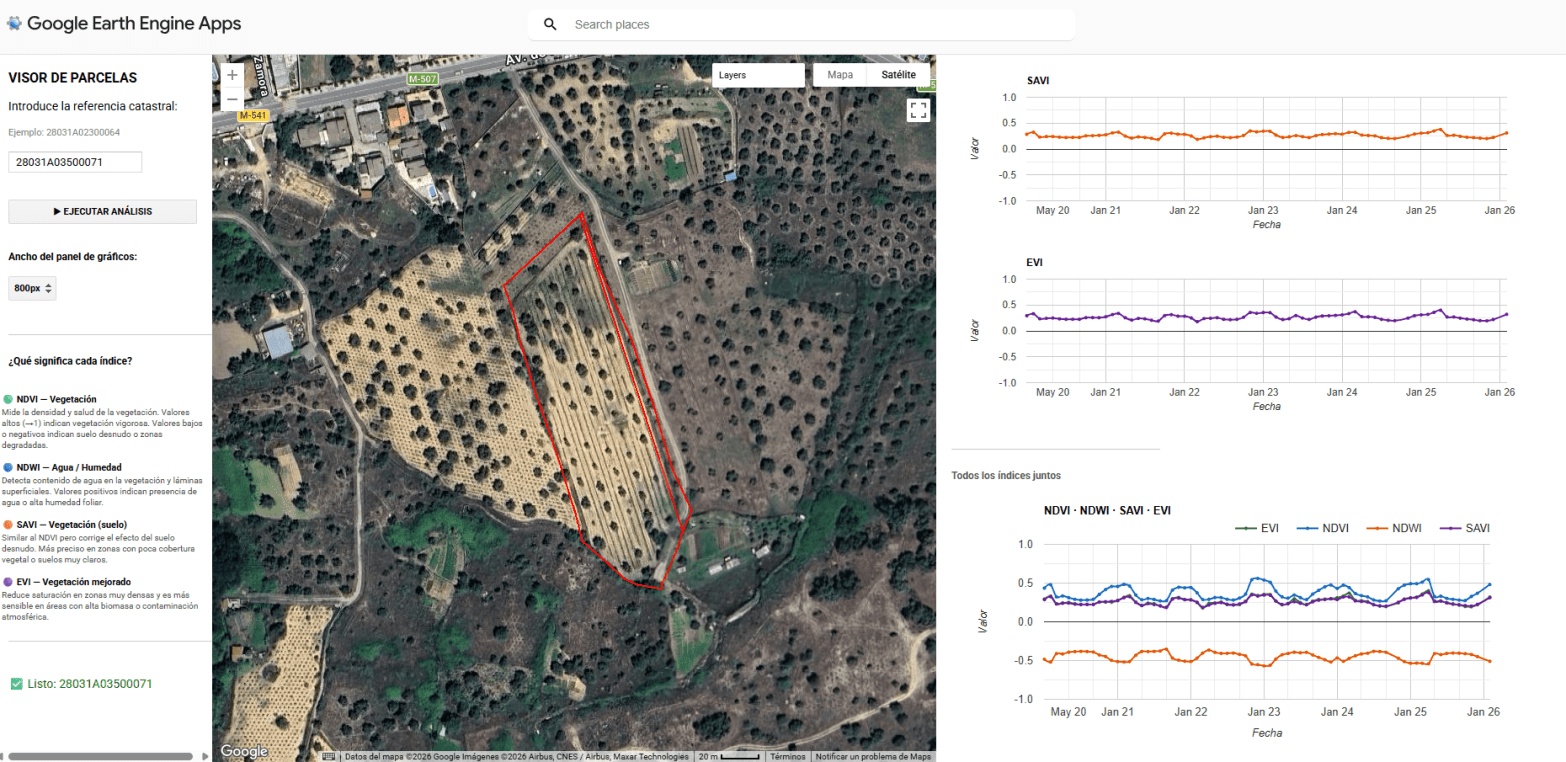
La convergencia entre el Big Data geoespacial y la administración pública ofrece una oportunidad sin precedentes para la optimización agronómica. La capacidad de procesamiento de Google Earth Engine (GEE), vinculada a la cartografía vectorial del Catastro rural, permite transformar las series temporales de misiones como Sentinel-2 en herramientas de diagnóstico directo sobre la parcela. Este enfoque desplaza el análisis de una observación puramente visual a una monitorización cuantitativa basada en la respuesta espectral de los cultivos. El núcleo de esta aplicación reside en la intersección geométrica de las parcelas catastrales con colecciones de imágenes multiespectrales. Mediante el uso de la API de JavaScript en GEE, se automatiza el cálculo de indicadores biofísicos críticos como el NDVI (Índice de Vegetación de Diferencia Normalizada), el NDWI (Índice de Agua de Diferencia Normalizada), el EVI (Índice de Vegetación Mejorado) y el SAVI (Índice de Vegetación Ajustado al Suelo). Estos índices no solo reflejan el vigor fotosintético, sino que permiten identificar anomalías de crecimiento, estrés hídrico o variaciones en la densidad foliar que son invisibles al ojo humano en las fases tempranas del ciclo fenológico.
Aventuras y desventuras de un geógrafo en “desarrollo”
La cartografía siempre ha sido un oficio de precisión, paciencia y criterio espacial. Durante años, el flujo de trabajo de cualquier geógrafo pasaba inevitablemente por entornos de escritorio como ArcGIS Pro o QGIS: cargar capas, ajustar simbología, exportar mapas. Herramientas sólidas, probadas, indispensables. Pero algo está cambiando.
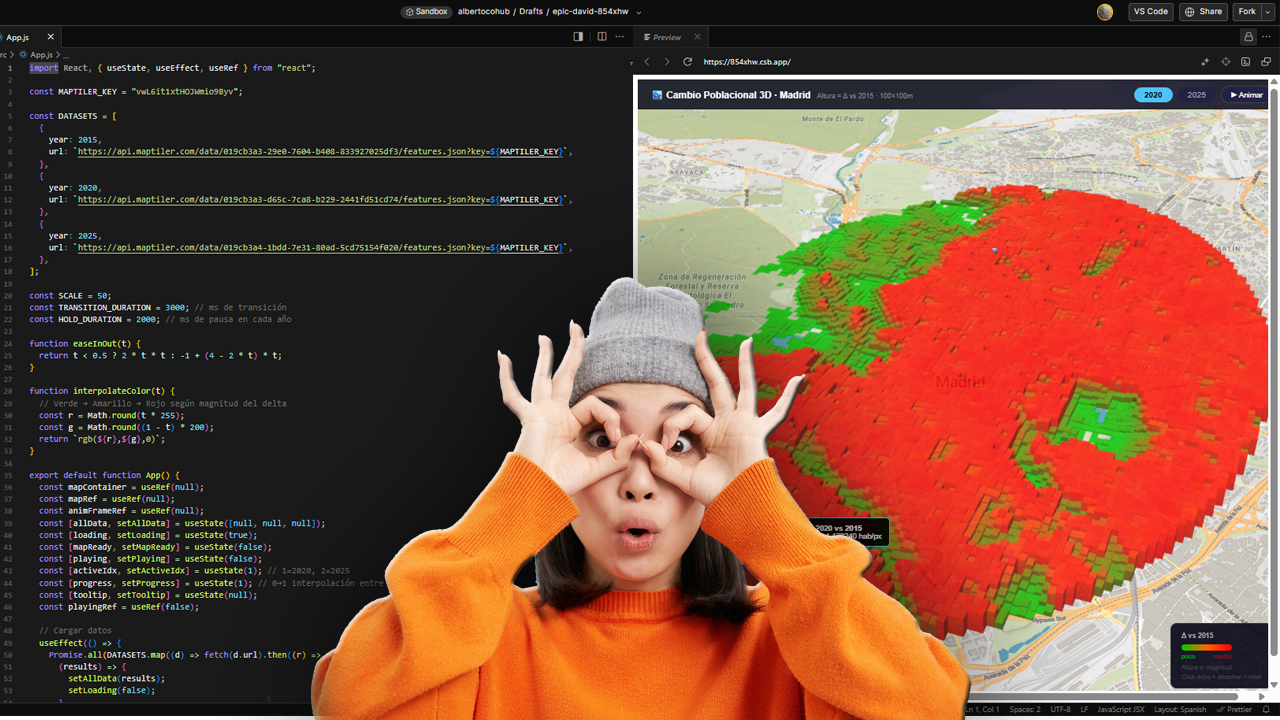
Cada vez más, el análisis espacial ocurre en la nube, en navegadores, en entornos de código. En anteriores post habéis visto algunos test/ideas/aplicaciones que he desarrollado con Javascript Google Earth Engine, que procesa imágenes satelitales a escala planetaria sin mover un solo archivo. Deck.gl y Maplibre renderizan millones de puntos en 3D directamente en el navegador. React convierte un mapa en una aplicación interactiva con pocas líneas de código.
ESTIMATED GHSL vs INE 2025
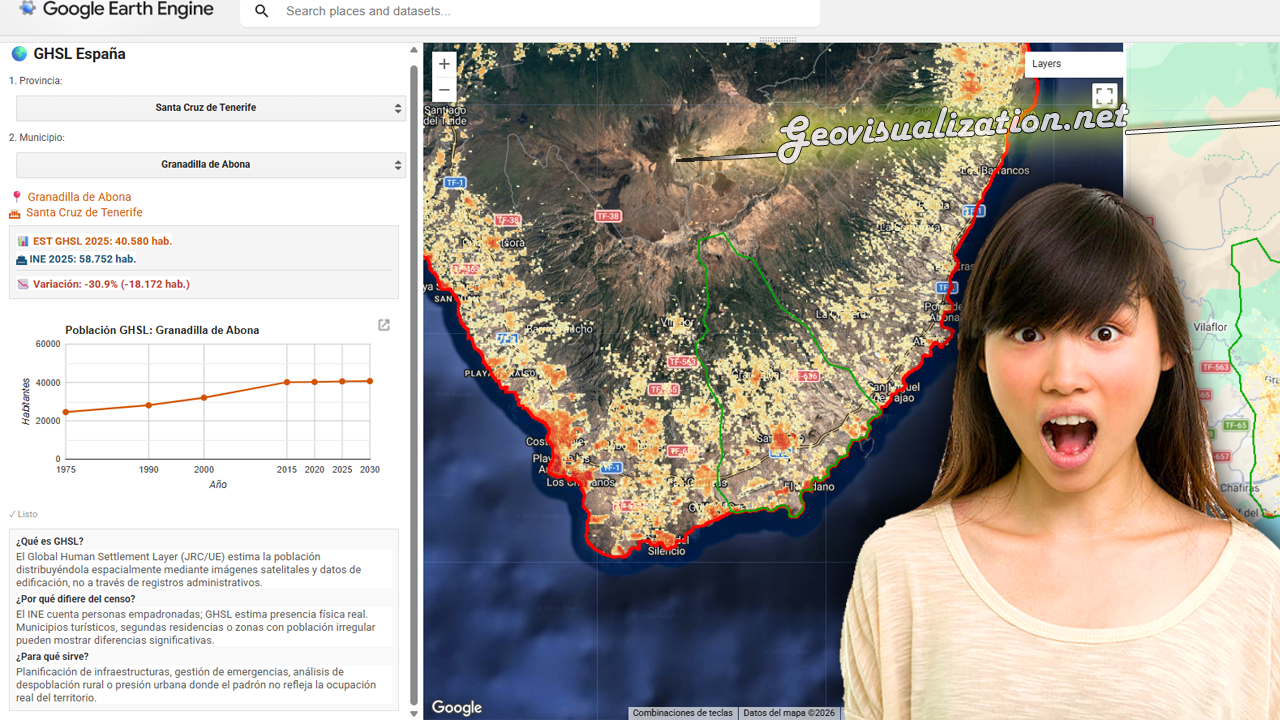
He desarrollado este COMPARADOR DE POBLACIÓN GHSL vs PADRÓN INE 2025 en JavaScript/Google Earth Engine que cruza estimaciones satelitales de población con los datos oficiales del censo español municipio a municipio.
La herramienta permite seleccionar cualquier provincia y municipio de España, visualizar la distribución espacial de población estimada por el GHSL con el último dato oficial del INE 2025, detectando municipios con alta presión turística, despoblación real o población no registrada.
Una aplicación directa para planificación de infraestructuras, gestión de emergencias o análisis de cohesión territorial donde el padrón no refleja la ocupación real del territorio.
URBAN ATLAS 2018 + WORLDPOP 100m/GHSL 100m estimates over Madrid
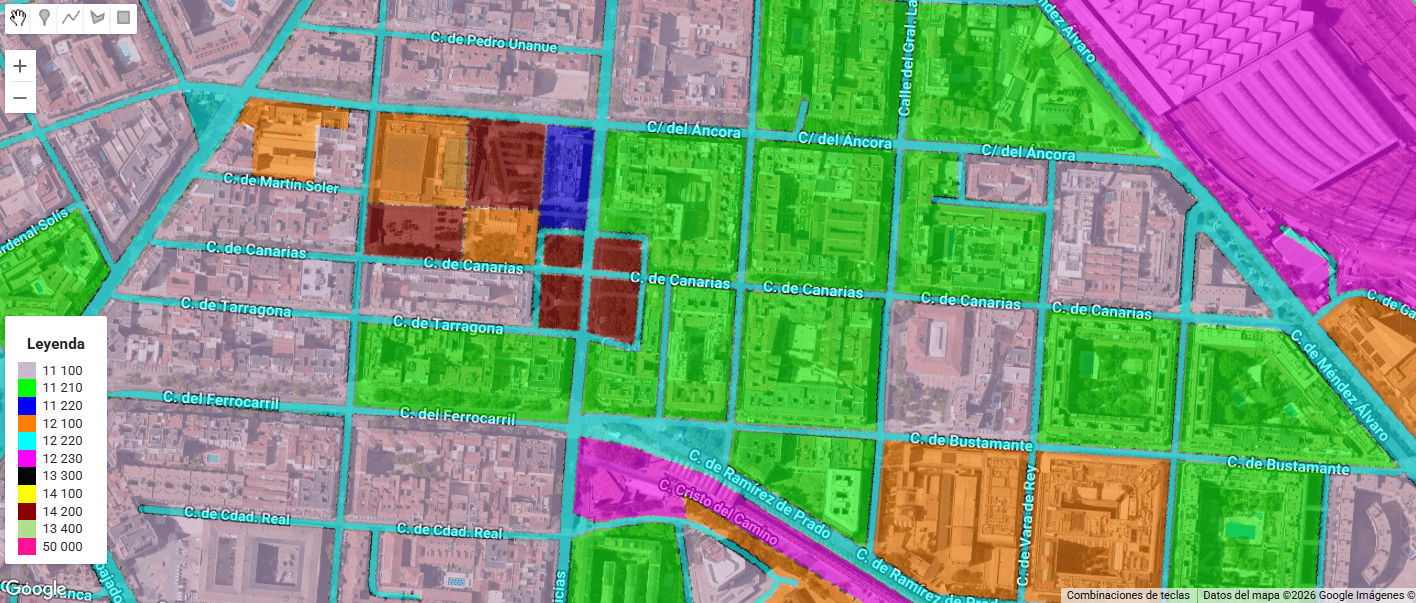
Urban Atlas (UA) representa el estándar de oro dentro del Copernicus Land Monitoring Service (CLMS) para el análisis de la morfología urbana en Europa. A diferencia de Corine Land Cover, UA ofrece una resolución temática y espacial drásticamente superior (Unidad Mínima de Mapeo de 0.25 ha para clases urbanas), permitiendo discriminar entre tejidos urbanos continuos y discontinuos con una precisión de densidad del 10% al 80%.
