 Do these two variables have a correlation?. To answer this important question first of all we have to know that only if it’s a linear relationship and there are no outliers we can take advantage of Mr Pearson’s correlation statiscal tool.
If i love chocolate, does this mean i have tendency of being chuby? or on the other hand there’s no relationship at all. Let’s figure it out.
For this particular occasion, input data XY are two DTM heights, my guess is the following: if correlation is too big, i may deduce they’re not independent products and one might been created from the other, in other words, we might have tried to cheat and we are using a different source that the one we have stated… In GIS sometimes things are not exactly as expected and there’s need to be assertive and making a plan for discovering this minor issues.
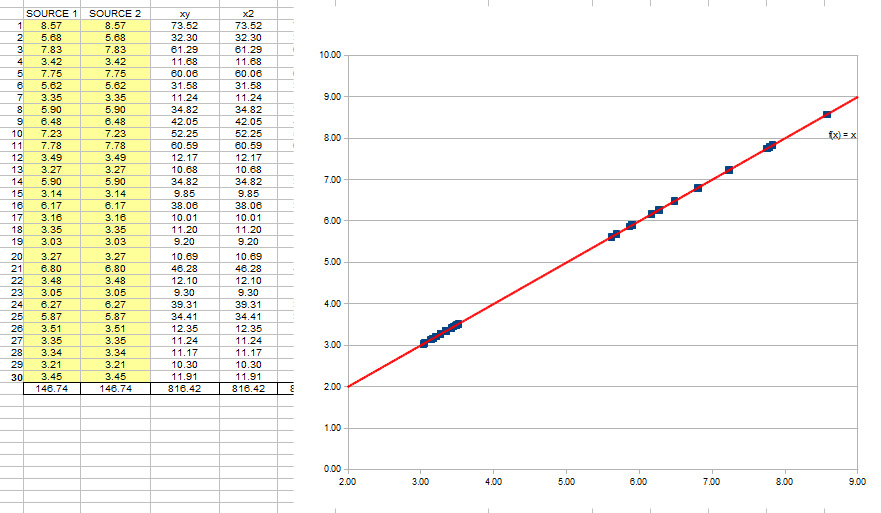
Let’s start from the beginning, if source 1 is the same as source 2, the correlation would be perfect, is this correct?. The answer is yes. r (Person correlation) would be = 1. So yes, if this was asking about chocolate and fleshiness this would be 100% right but this hardly or never happens in real life (direct and no other explanation or variable interaction… why is always so0o complicated?).

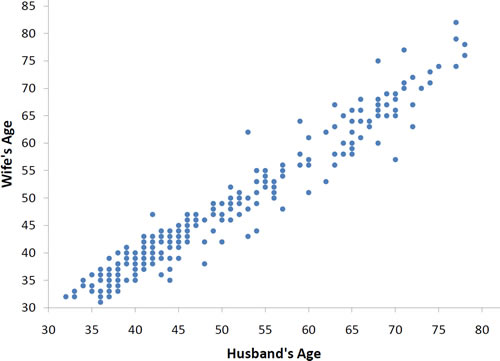
With real data, you would not expect to get values of r of exactly -1, 0, or 1. For example, the data for spousal ages (white couples) has an r of 0.97. Don’t ask me where i got this weird source (well, just in case: http://onlinestatbook.com/2/describing_bivariate_data/intro.html)
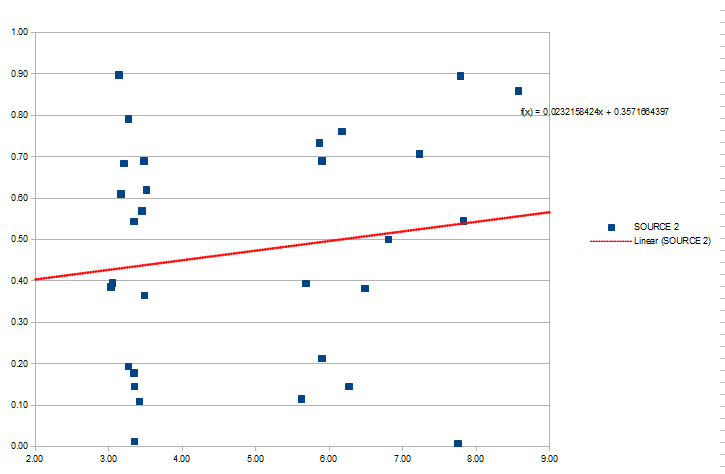
If i fill source 2 with a random number, the correlation would be almost none accordingly (in this case r=0.17)
Now if we see the diagram of the first two sources and we get the Pearson correlation coefficient (r=0.24) which means the correlation is very weak.

But that was only a very small part of the table (only 30 iterations), so if i do the same calculation out of the +13,000 iterations i really need, i get these figures (by the way, theres no need to use such a complicated formula above, you can use this one in EXCEL: =PEARSON(A1:An;B1:Bn))

So the correlation now its moderate, which makes me deduct at least the sources seem different and i’d need more clues to think my customer might have tried to actually cheat me using the same source for both datasets.
Summarizing:
r=1, correlation is PERFECT
0.75<r<1, correlation is STRONG
0.5<r<0.75, correlation is MODERATE
0.25<r<0.5, correlation is WEAK
<0.25, almost NO correlation, both variables are hardy related
I hope you guys have found this post interesting,
looking forward to hear where could you use it and/or your feedback,
Regards,
Alberto C.
MSc GIS

One thought on “Pearson correlation and GIS”