
I am here in front of my desktop and I wonder how to take advantage of Sentinel Hub for tracking up moisture in a random plot anywhere in the world. Has it been irrigated at the right time for the type of crop? How has rainfall been affected over the analysis time? How has the use of certain fertilisers affected it? Has it positively affected production?. Let’s take a closer look.
The NDMI is a normalized difference moisture index, that uses NIR and SWIR bands to display moisture. The SWIR band reflects changes in both the vegetation water content and the spongy mesophyll structure in vegetation canopies, while the NIR reflectance is affected by leaf internal structure and leaf dry matter content but not by water content. The combination of the NIR with the SWIR removes variations induced by leaf internal structure and leaf dry matter content, improving the accuracy in retrieving the vegetation water content. The amount of water available in the internal leaf structure largely controls the spectral reflectance in the SWIR interval of the electromagnetic spectrum. SWIR reflectance is therefore negatively related to leaf water content. In short, NDMI is used to monitor changes in water content of leaves, and was proposed by Gao. NDWI is computed using the near infrared (NIR) and the short wave infrared (SWIR) reflectance’s:
Sentinel-2 NDMI = (B08 – B11) / (B08 + B11)
Note: NDWI index is often used synonymously with the NDMI index, often using NIR-SWIR combination as one of the two options. Gao, referenced above, also called the index NDWI. NDMI seems to be consistently described using NIR-SWIR combination. As the indices with these two combinations work very differently, with NIR-SWIR highlighting differences in water content of leaves, and GREEN-NIR highlighting differences in water content of water bodies, we have decided to separate the indices on our repository as NDMI using NIR-SWIR, and NDWI using GREEN-NIR.
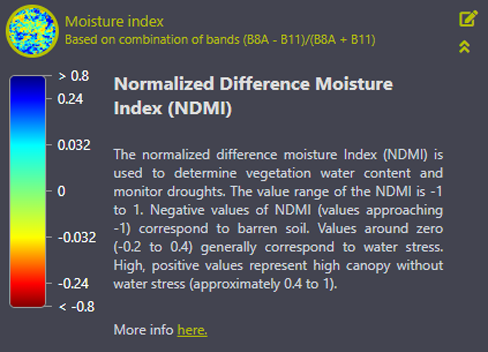
The normalized difference moisture Index (NDMI) is used to determine vegetation water content and monitor droughts. The value range of the NDMI is -1 to 1. Negative values of NDMI (values approaching -1) correspond to barren soil. Values around zero (-0.2 to 0.4) generally correspond to water stress. High, positive values represent high canopy without water stress (approximately 0.4 to 1).
These are the bands we can use in Sentinel 2 platform:

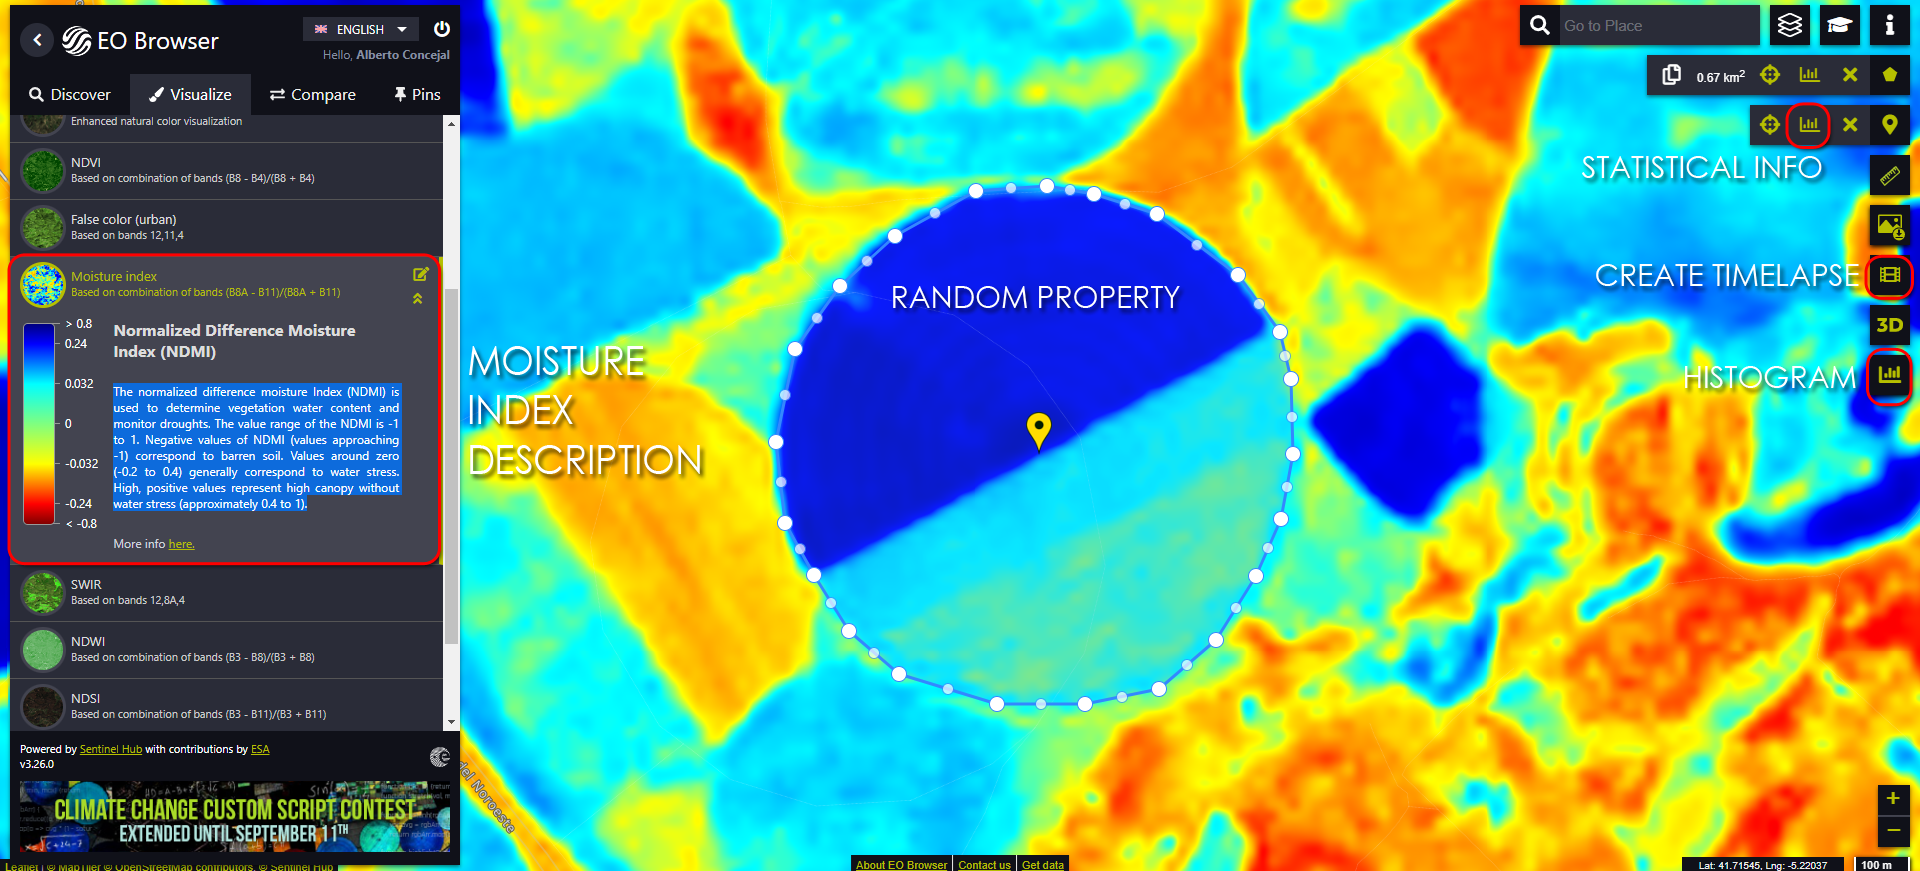
This is the random plot I have chosen, latitude 41.71715 longitude -5.22810, somewhere in Valladolid (Spain). Does anybody know why did I choose this province? Well, I got my degree in this city, back in 1998. Time flies !.
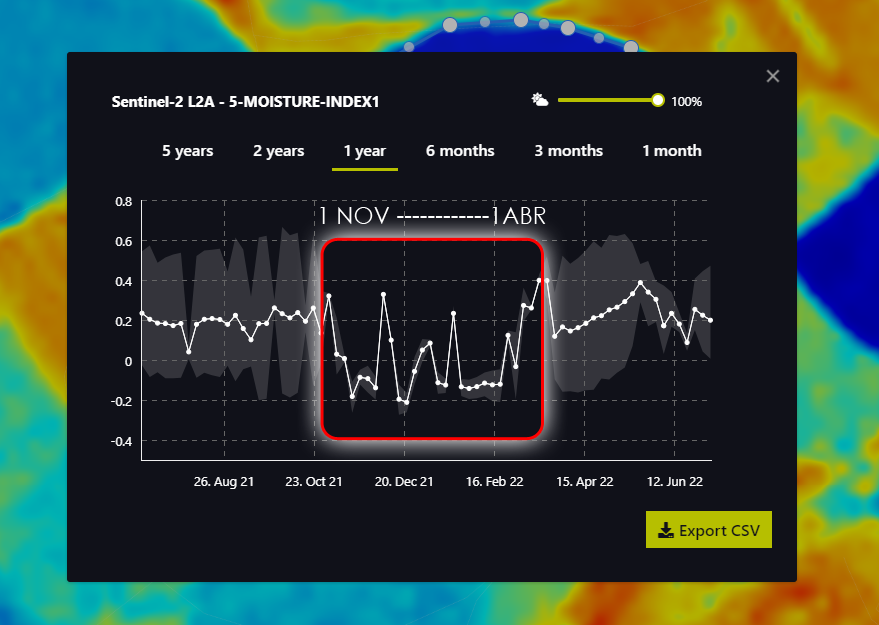
Water stress over certain period (5 months from November to April 2022).
This is the histogram covering the whole of the area of analysis.

And a sequence from June 2021 to June 2022, covering all seasons of the year.
Hope you find it interesting. If you need me to further develope it, a quote or simply say hello, you can contact me anytime,
Alberto
GIS analyst
Sources:
https://gisgeography.com/sentinel-2-bands-combinations/
https://custom-scripts.sentinel-hub.com/sentinel-2/ndmi/
https://agupubs.onlinelibrary.wiley.com/doi/10.1029/2007GL031021#:~:text=%5B9%5D%20In%20order%20to%20show,and%20vegetation%20have%20been%20investigated.
https://www.sciencedirect.com/science/article/pii/S221209472100027X
https://apps.sentinel-hub.com/

hi Alfredo,what tool was used for the viasualization?i’ve been looking for such a tool for some time now