Setting up Mapterhorn terrain in RStudio

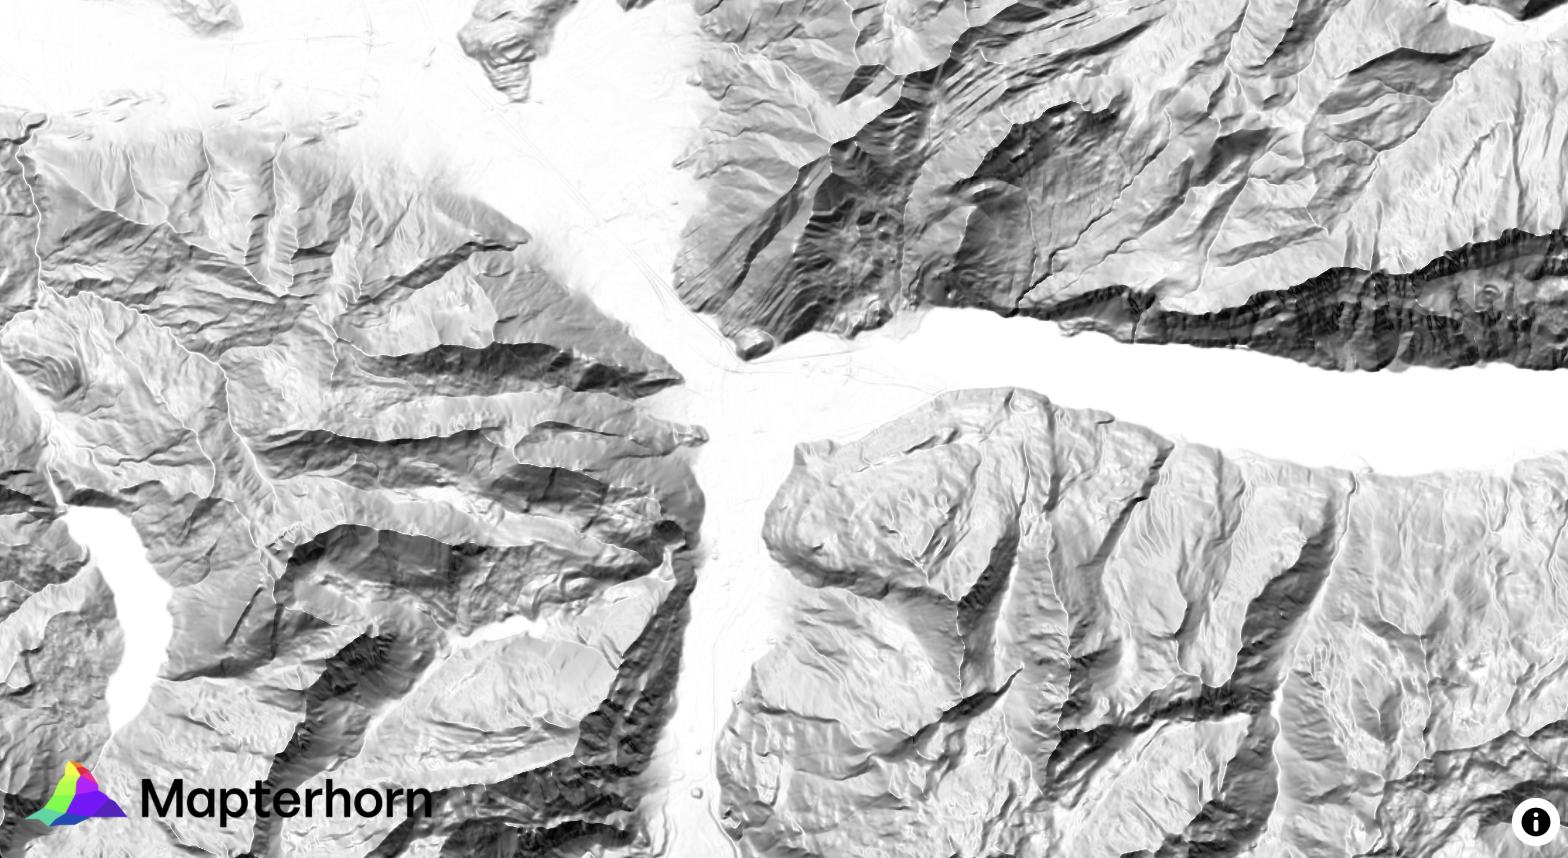
¿Alguna vez has querido visualizar el relieve de un territorio en 3D directamente desde R, sin depender de software GIS externo? Mapterhorn es un proyecto open source que distribuye modelos digitales de elevación (MDT) de alta resolución — hasta 2 metros en España — empaquetados en formato PMTiles, un estándar moderno que permite servir datos geoespaciales sin necesidad de un servidor propio.

En este post veremos cómo configurar Mapterhorn en R usando el paquete mapgl en Rstudio, que nos permite crear mapas interactivos con terreno 3D en pocas líneas de código. El resultado: visualizaciones como la que ves abajo, con sombreado de relieve (hillshade) generado directamente desde los datos de elevación del IGN.
Aventuras y desventuras de un geógrafo en “desarrollo”

La cartografía siempre ha sido un oficio de precisión, paciencia y criterio espacial. Durante años, el flujo de trabajo de cualquier geógrafo pasaba inevitablemente por entornos de escritorio como ArcGIS Pro o QGIS: cargar capas, ajustar simbología, exportar mapas. Herramientas sólidas, probadas, indispensables. Pero algo está cambiando.

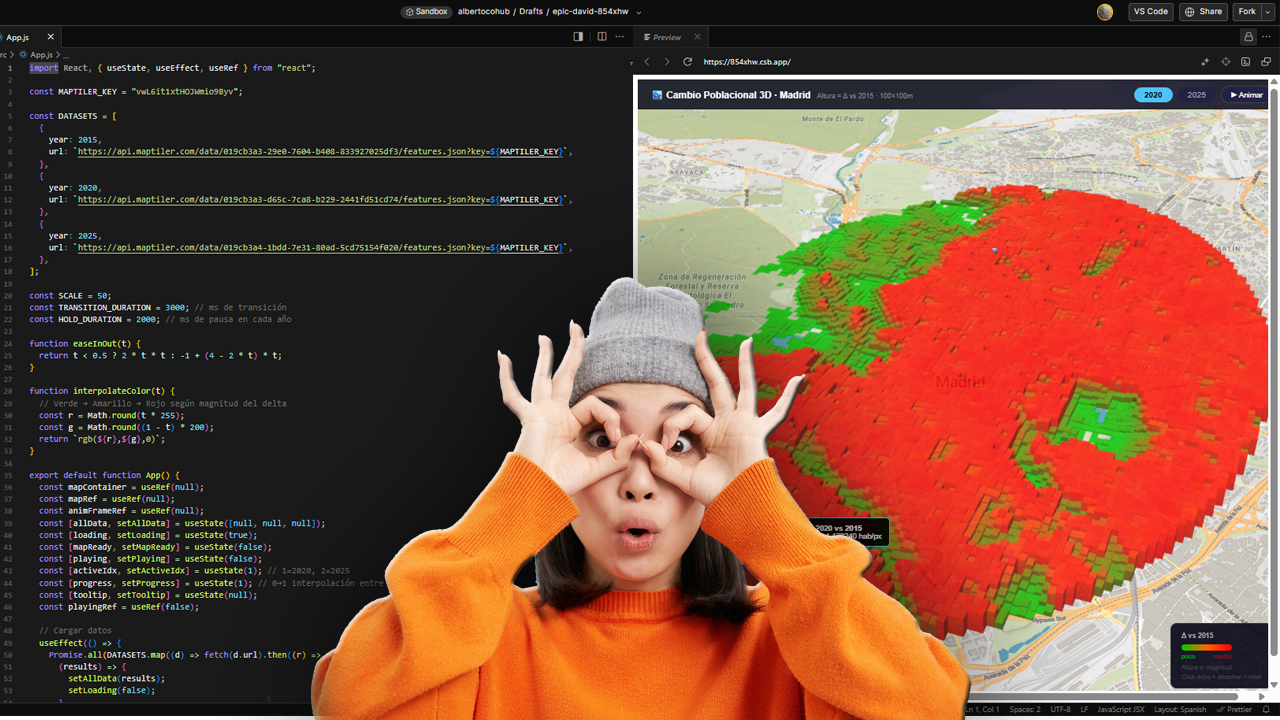
Cada vez más, el análisis espacial ocurre en la nube, en navegadores, en entornos de código. En anteriores post habéis visto algunos test/ideas/aplicaciones que he desarrollado con Javascript Google Earth Engine, que procesa imágenes satelitales a escala planetaria sin mover un solo archivo. Deck.gl y Maplibre renderizan millones de puntos en 3D directamente en el navegador. React convierte un mapa en una aplicación interactiva con pocas líneas de código.

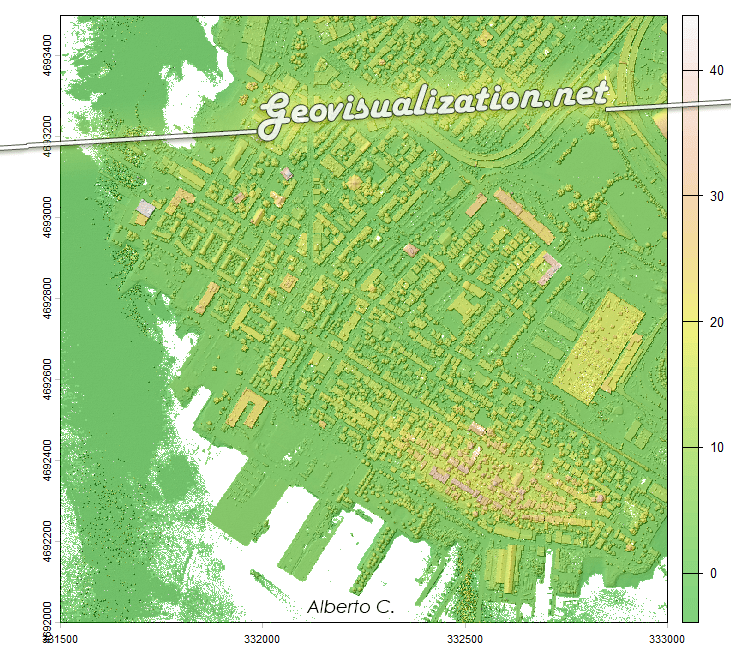
From LIDAR USGS to DSM in a few lines of code. The magic of R

The USGS LiDAR Explorer, hosted via gishub.org, serves as a high-performance web gateway for interacting with the USGS 3D Elevation Program (3DEP) datasets. First thing, go to this GITHUB repository https://github.com/opengeos/maplibre-gl-usgs-lidar, download code for the project (code>download ZIP), get connected with RStudio, save new project and open a script window… It’s all set up!

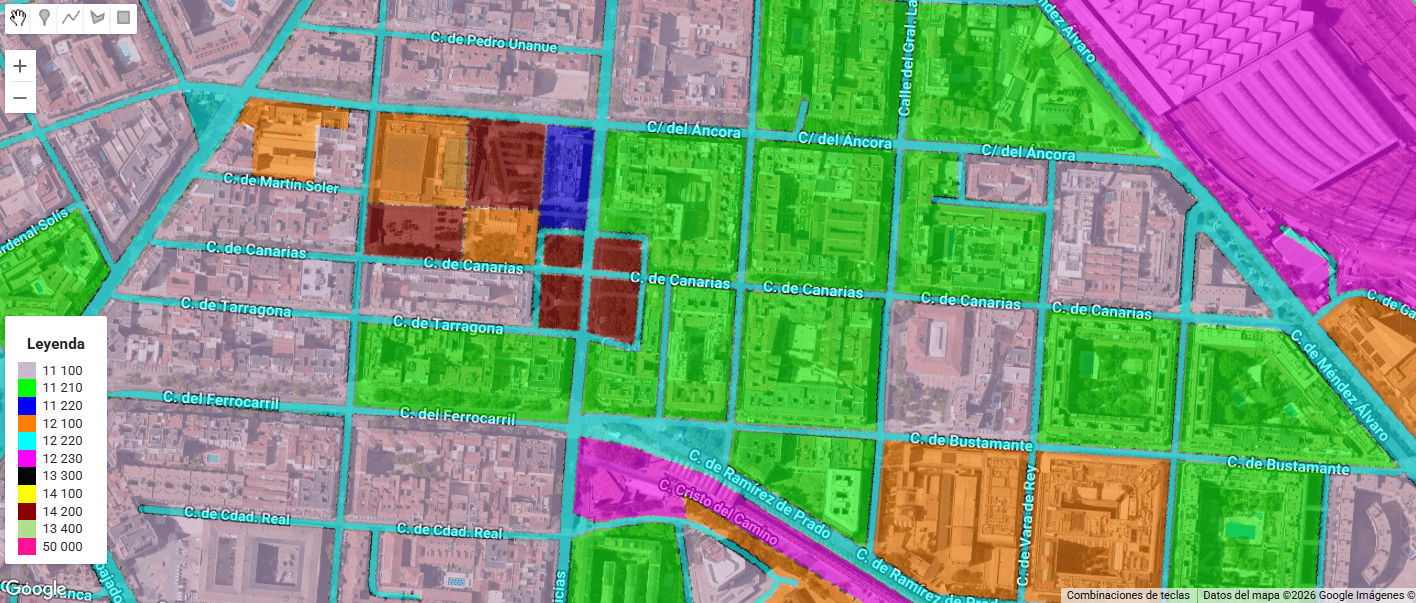
URBAN ATLAS 2018 + WORLDPOP 100m/GHSL 100m estimates over Madrid

Urban Atlas (UA) representa el estándar de oro dentro del Copernicus Land Monitoring Service (CLMS) para el análisis de la morfología urbana en Europa. A diferencia de Corine Land Cover, UA ofrece una resolución temática y espacial drásticamente superior (Unidad Mínima de Mapeo de 0.25 ha para clases urbanas), permitiendo discriminar entre tejidos urbanos continuos y discontinuos con una precisión de densidad del 10% al 80%.

Analyzing Spatial Correlation between Purchase Power Index and Gambling Stores (2)

This GIS study applies Geographically Weighted Regression (GWR) to investigate the spatial relationship between Purchasing Power Index (PPI) and the distribution of gambling-related retail establishments within the city of Madrid. My aim is to account for spatially varying relationships driven by local urban contexts, under the assumption that the relationship between socioeconomic conditions and the presence of gambling venues varies across urban space. My hypothesis is that the socioeconomic conditions of the urban fabric can be a breeding ground for the location of betting shops, or in other words, I am attempting to Detect Urban Vulnerability to Gambling Harm.

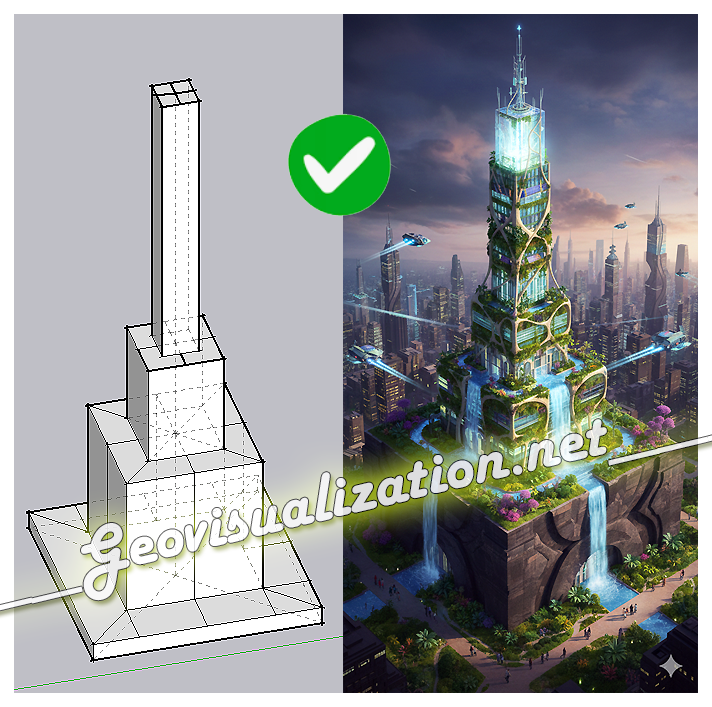
Testing GEMINI for 3D environments. From SketchUp to an unlikely future!

The exercise shows how a simple SketchUp 3D volume, defined solely by its basic geometry, can be transformed into a complex architectural proposal. Starting from the initial schematic model, the system interprets proportions, levels, and shapes, and converts them into a fully developed building, complete with textures, vegetation, lighting, and an urban context

Mapping Something Unthinkable: Flood Risk in Madrid using Open Data

Dont get wrong if you see the IA background showing our handsome major almost showing his beautiful smile in Cibeles/Correos it’s only to get your attentions (only if you need it thou!). Flooding in urban environments is not a speculative hazard but something we can quantify. In the case of Madrid, the intersection of pretty mountainous terrain (it might surprise you there are 2000m difference between the highest spot in Madrid province, Pico Peñalara -2428m- and the Alberche river environment in some areas -430m-) and urban expansion presents a scenario of significant risk, particularly when analyzed through the lens of shared high-resolution geospatial data. This study integrates the buildings from BTN (Base Topográfica Nacional) provided by the Spanish “IGN”, the CNIG with the official flood hazard maps for a 100-year return period (T=100), published by the Ministry for the Ecological Transition and the Demographic Challenge (MITECO). The T=100 scenario is the most representative for evaluating long-term flood exposure, as it reflects events with a 1% annual probability—rare but not improbable, and certainly not negligible.

¡Al final se nos quema la península este 2025!

Este agosto, España y Portugal han vivido una temporada de incendios excepcionalmente dura. En España, las llamas han calcinado ~382.000 hectáreas (más de seis veces la media reciente) y han dejado víctimas mortales; en Portugal, las superficies quemadas superan las 200.000 hectáreas, muy por encima del promedio 2006–2024 para estas fechas. El humo cruzó fronteras y degradó la calidad del aire a cientos de kilómetros.

Palestine 2023-2024

The 7th of October will forever be remembered in our collective memory as a day of tragedy and senseless violence, an operation that would shatter the dream of Israel’s inviolability. The attacks by Hamas were unequivocally condemnable. The targeting of civilians (+1200 dead and +250 kidnappings) is never acceptable, and those responsible for such acts must be held accountable. However, the response that followed has escalated into something far worse, a state-driven campaign of violence by Israel that has, in just one year, claimed over 42,000 lives, a staggering number of whom are women and children. This is not defense; this is mass murder. GENOCIDE.

Measuring snow coverage using EOB – Earth Observation – Sentinel HUB

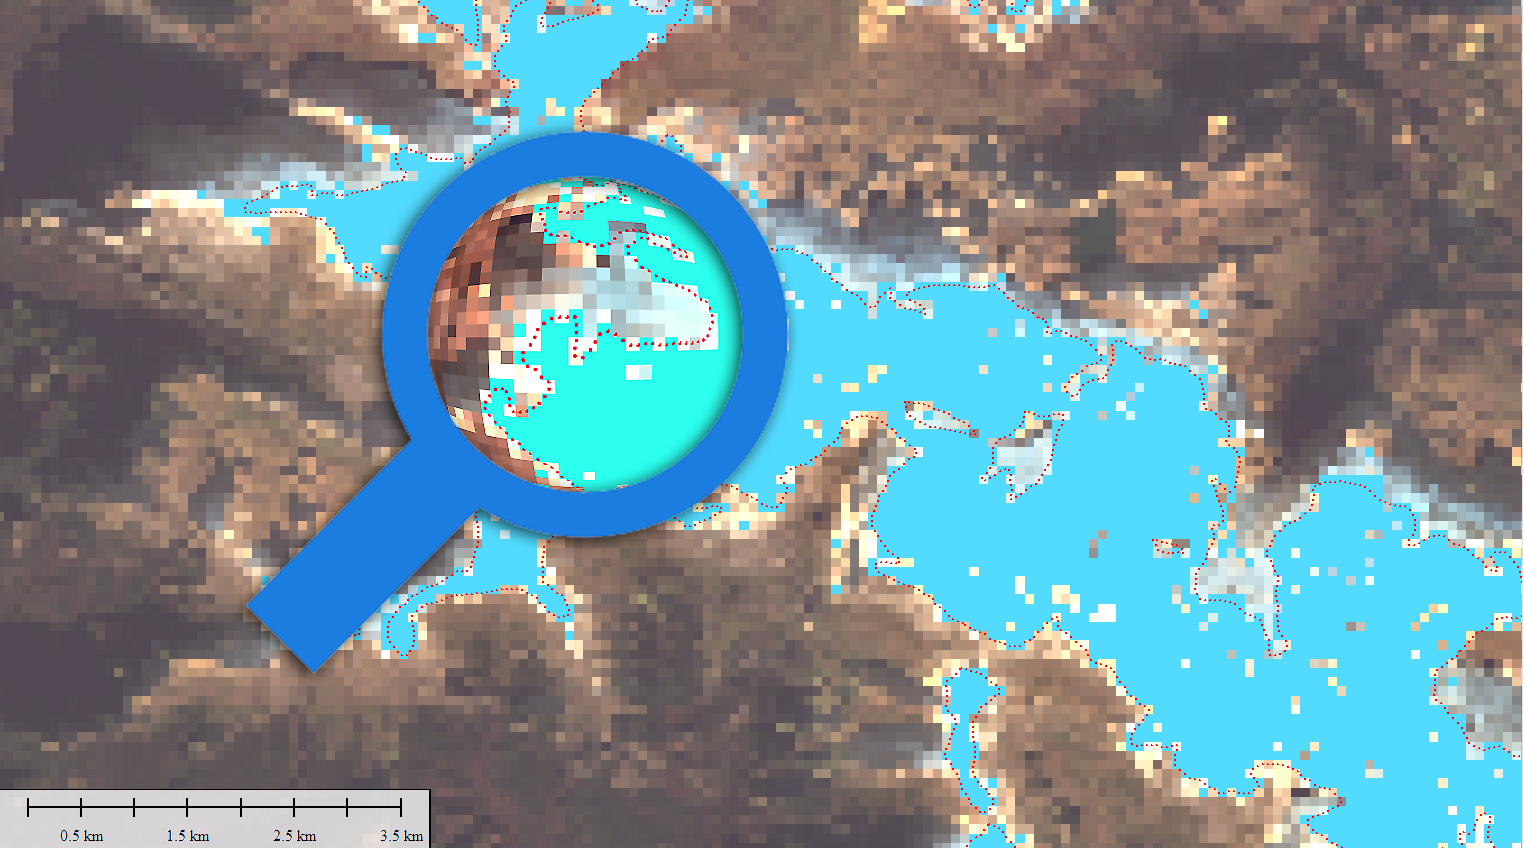
Playing with Sentinel 2 images I realized that the amount of snow this year has been very low compared to last winter. Here are a couple of images from January 2022 and 2023 of the Canfranc – Paticosa – Jaca area. One of the most interesting things about this EO browser is that in addition to a standard 2D visualisation, we can visualise in 3D. Here is an video example. Another interesting thing is to be able to quantify the snowfall. There is a snow classifier based on NSDI (Normalized Difference Snow Index, The Normalized Difference Snow Index (NDSI) snow cover is an index that is related to the presence of snow in a pixel and is a more accurate description of snow detection as compared to Fractional Snow Cover (FSC).