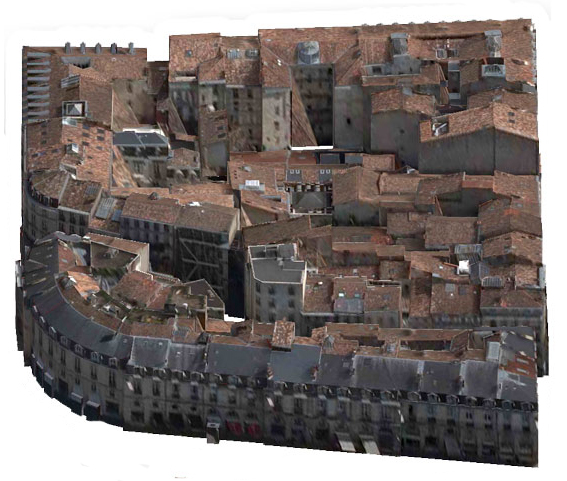
I would like to share with you an easy analysis i have been working in the last days. I had a vector dataset of buildings and i knew how high they were (there was a field called ‘AGL’ or Above Ground Level) and a LIDAR 2m resolution dataset over the city of London. My aim was comparing both sources, understanding LIDAR data was the actual reality (or a closer version to it) and my source of 3D buildings was the dataset i needed to deliver to my customer… Te actual height of those 3D buildings had been extracted using stereo photogrammetry methods. I also needed to focus on residential data, so heights below 15m… So make it easy. The question was:
How accurate is my dataset of residential buildings over London?. Which is the RMSE measuring them both?
I used Global Mapper v.13.2 (b062012) and ArcGIS 10.0 (b3200)
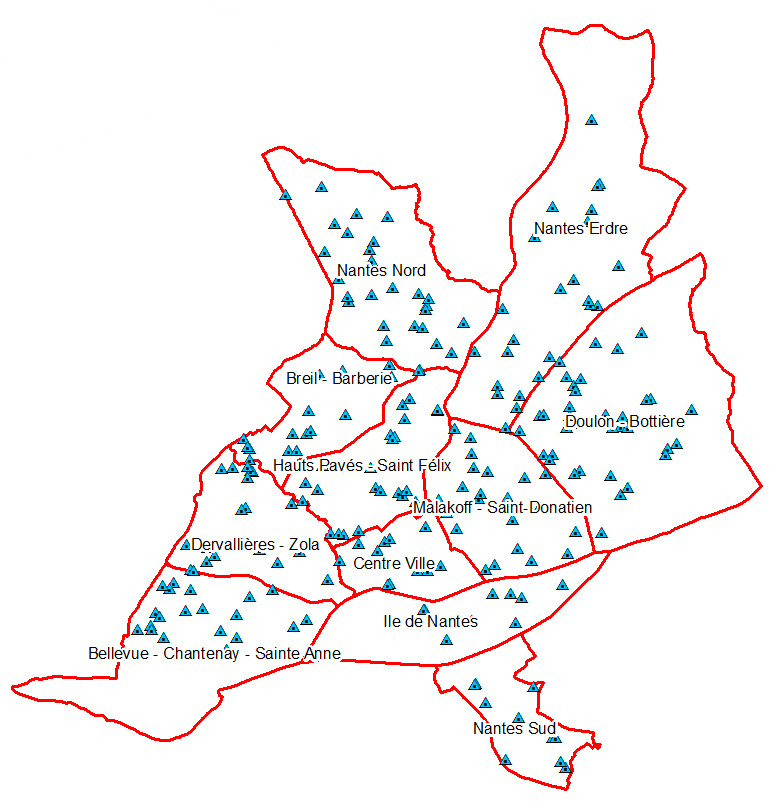
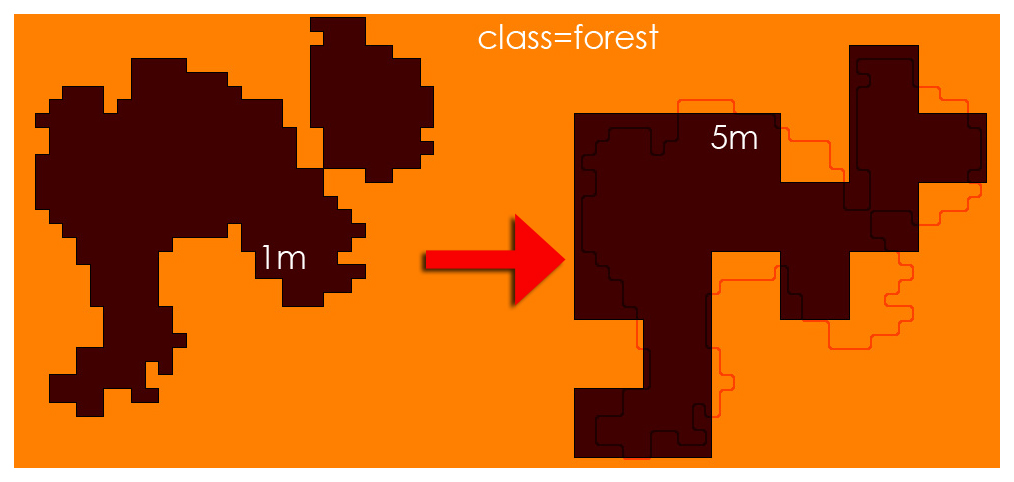
This is the 2m resolution LIDAR data provided by geomatics-group.co.uk

I also needed to get a layer of points out of this dataset so i used Global Mapper and went to Files/Export elevation grid format and choose ASCII as the format.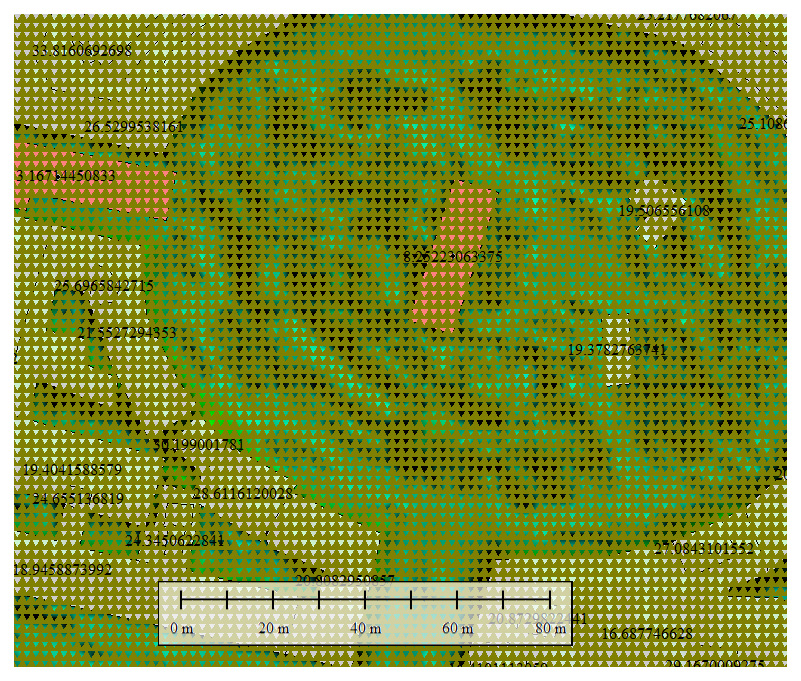
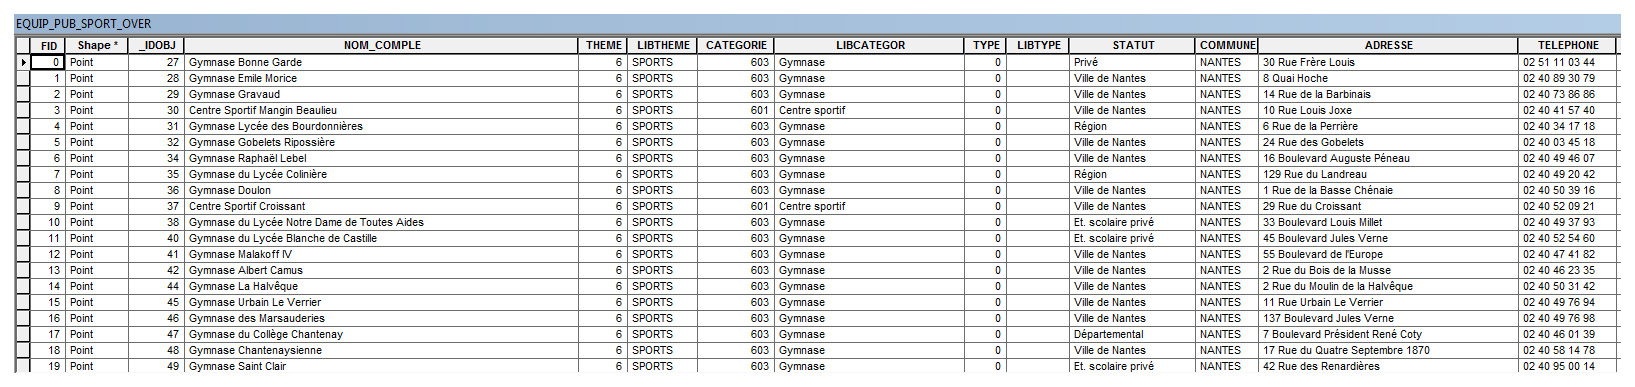
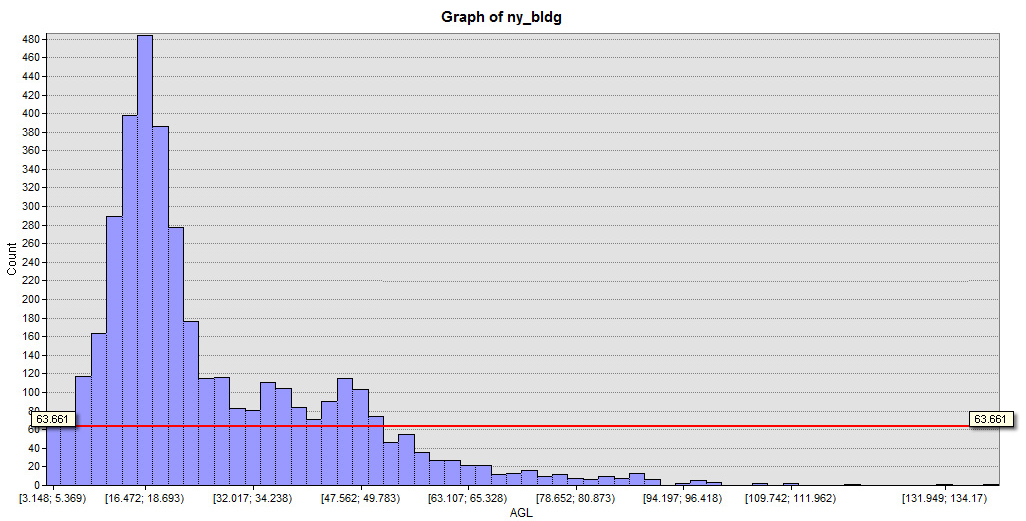
This is the layer of buildings and their AGL as label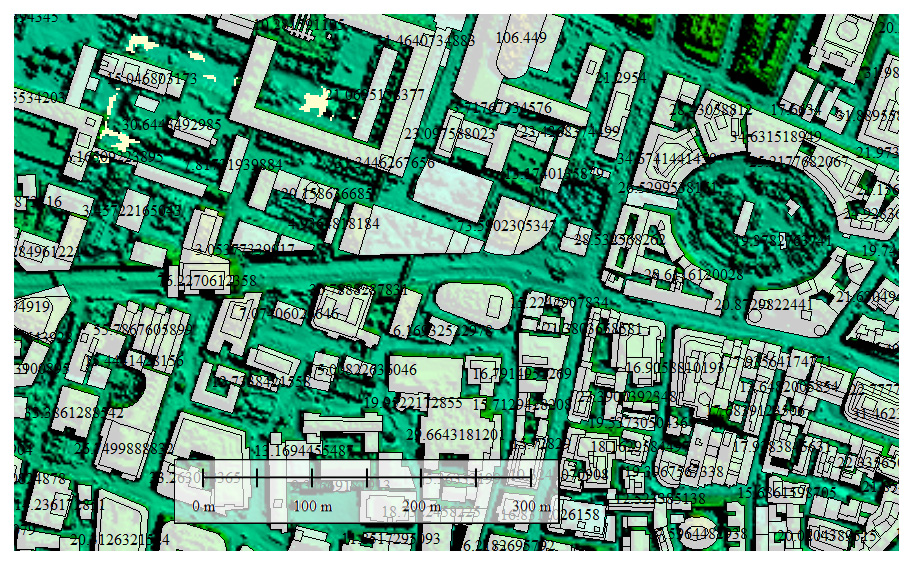
I flagged those residential buildings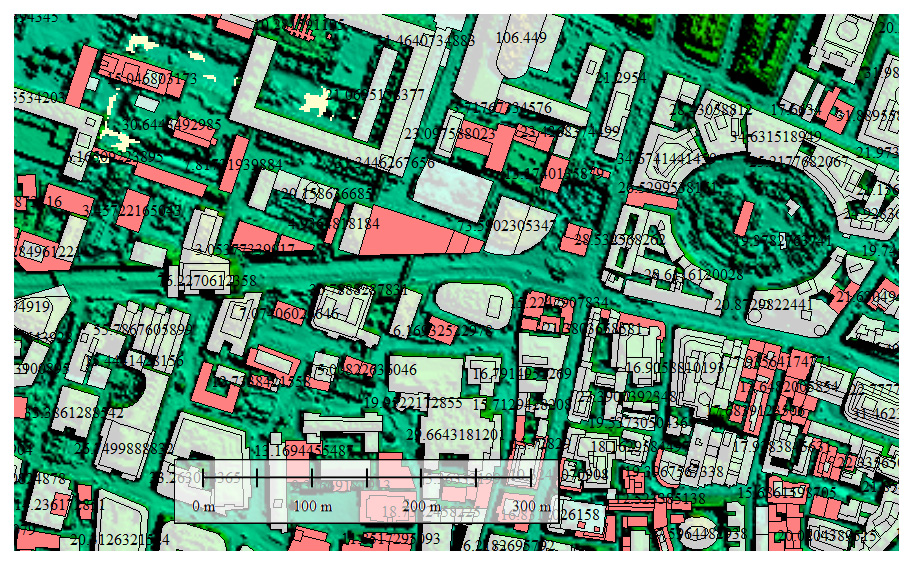
and using ArcGIS i performed a Spatial Analysis using Arctoolbox/Spatial analysis to join the Lidar heights in ASCII format and the residential heights… to be able to measure the difference between both datasets
this way i got a new vector layer which table contained both elevation fields (Lidar and my 3D buildings)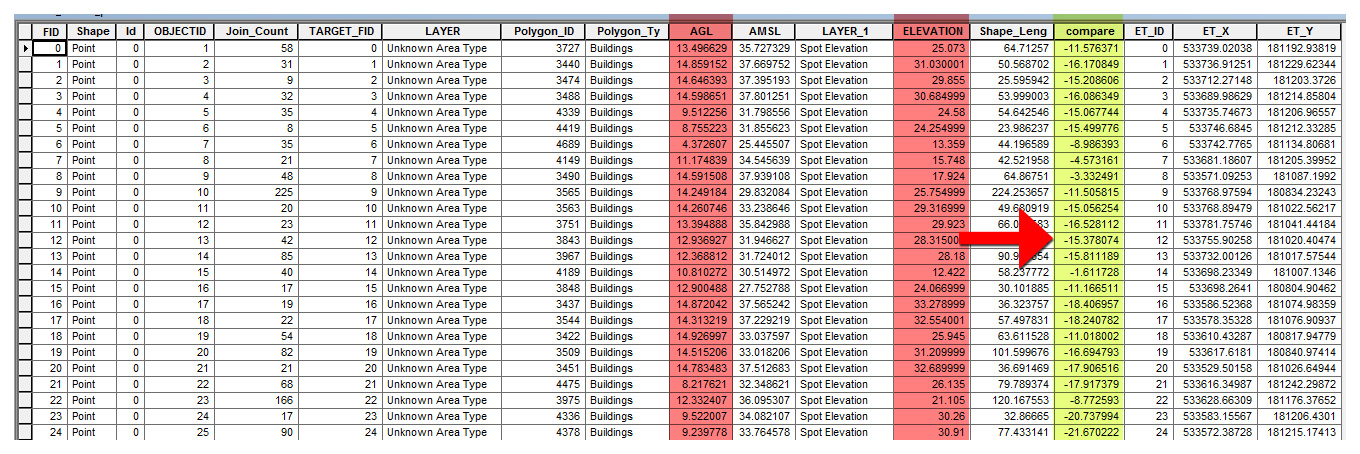
As you can see, i added a new field in ArcGis using table/add field and added ‘compare’ and SQL [“AGL”- “ELEVATION”]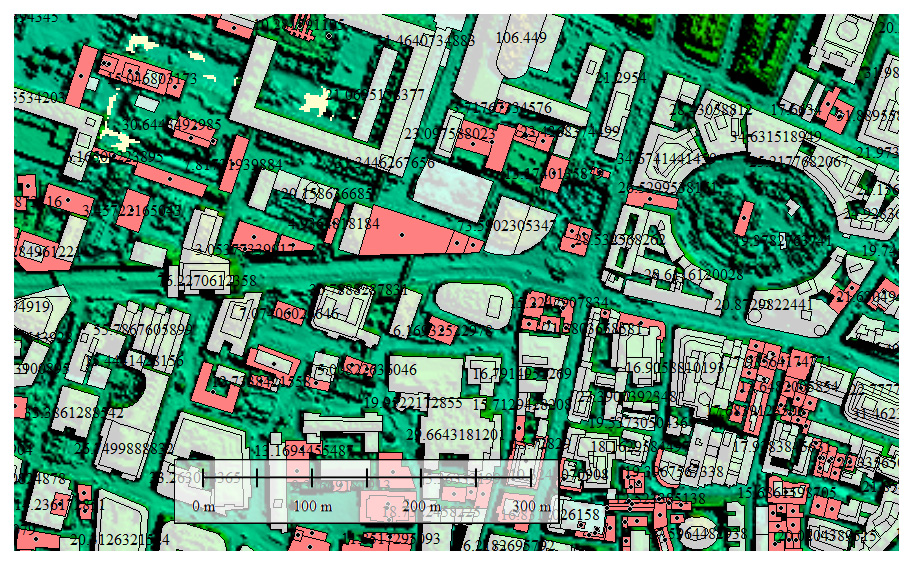
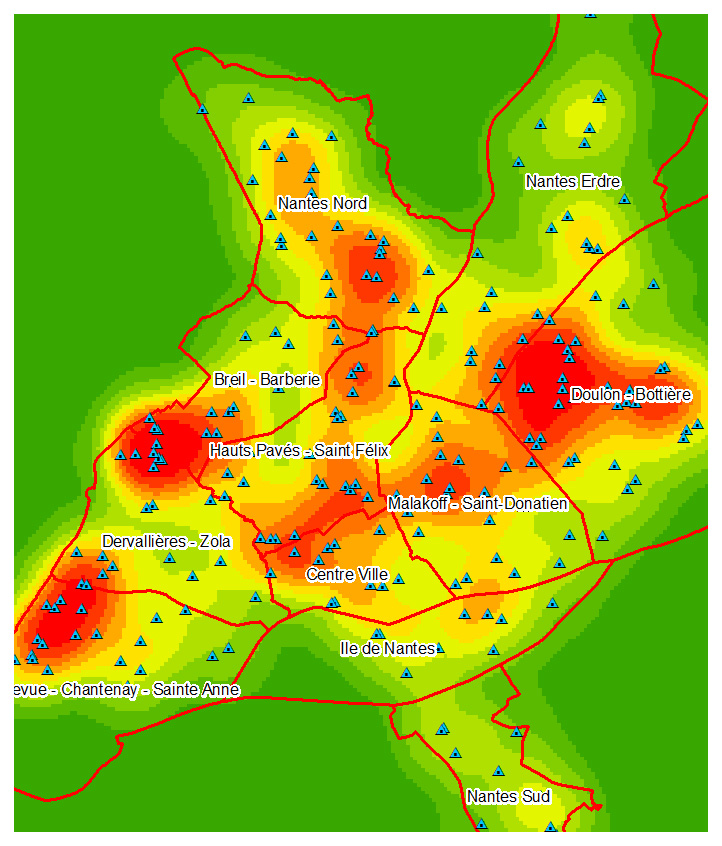
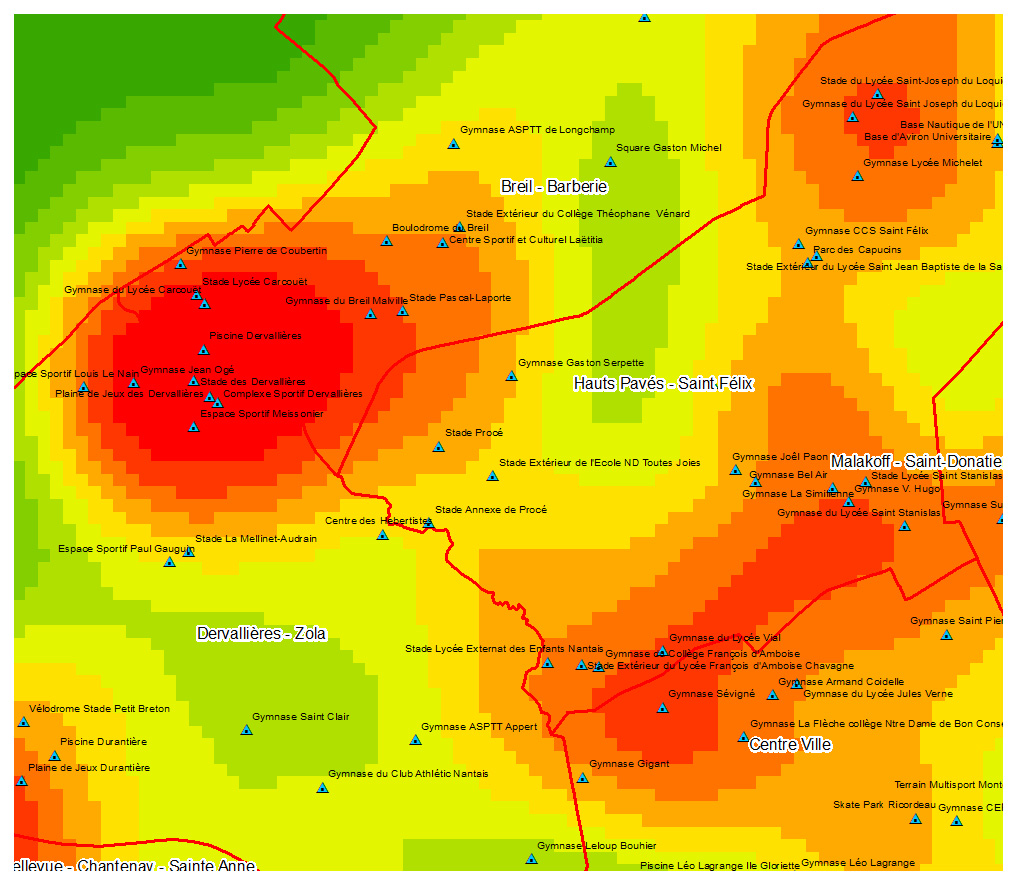
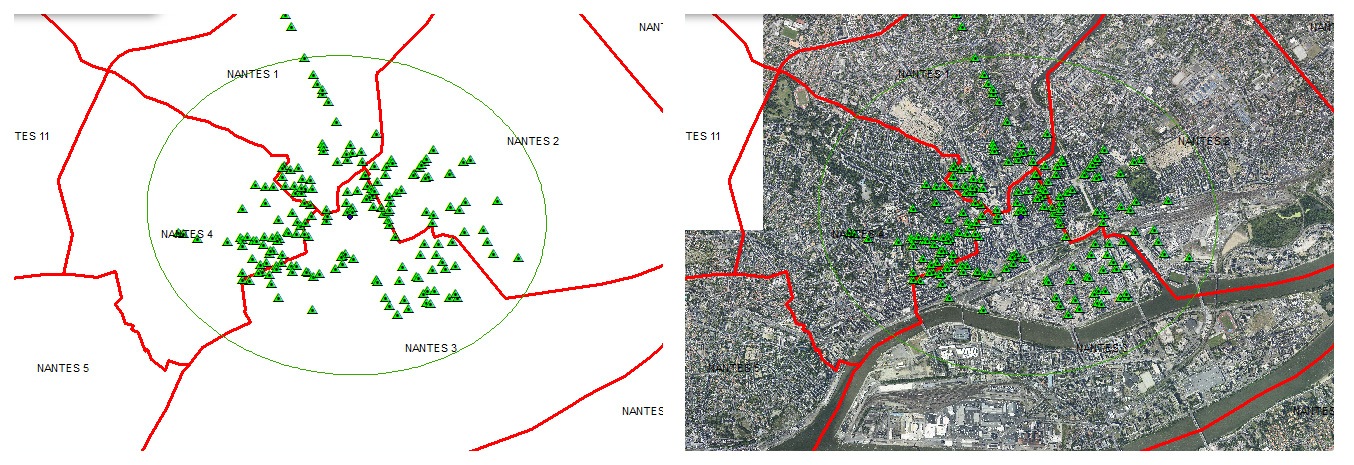
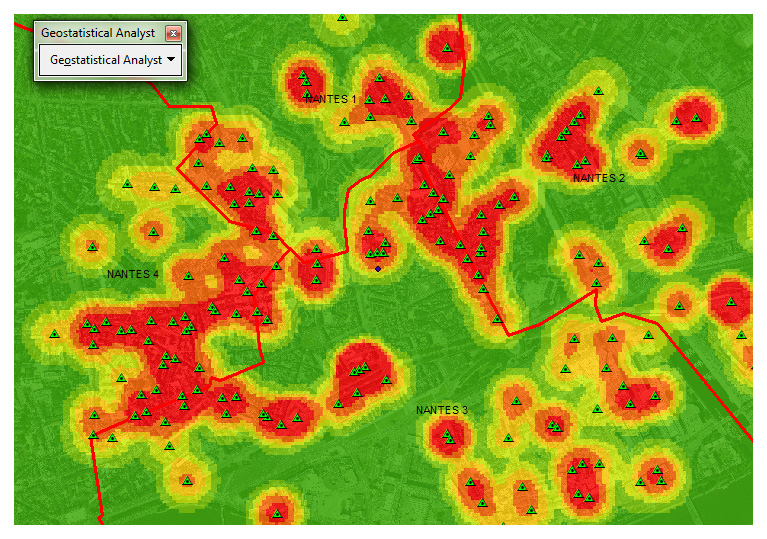
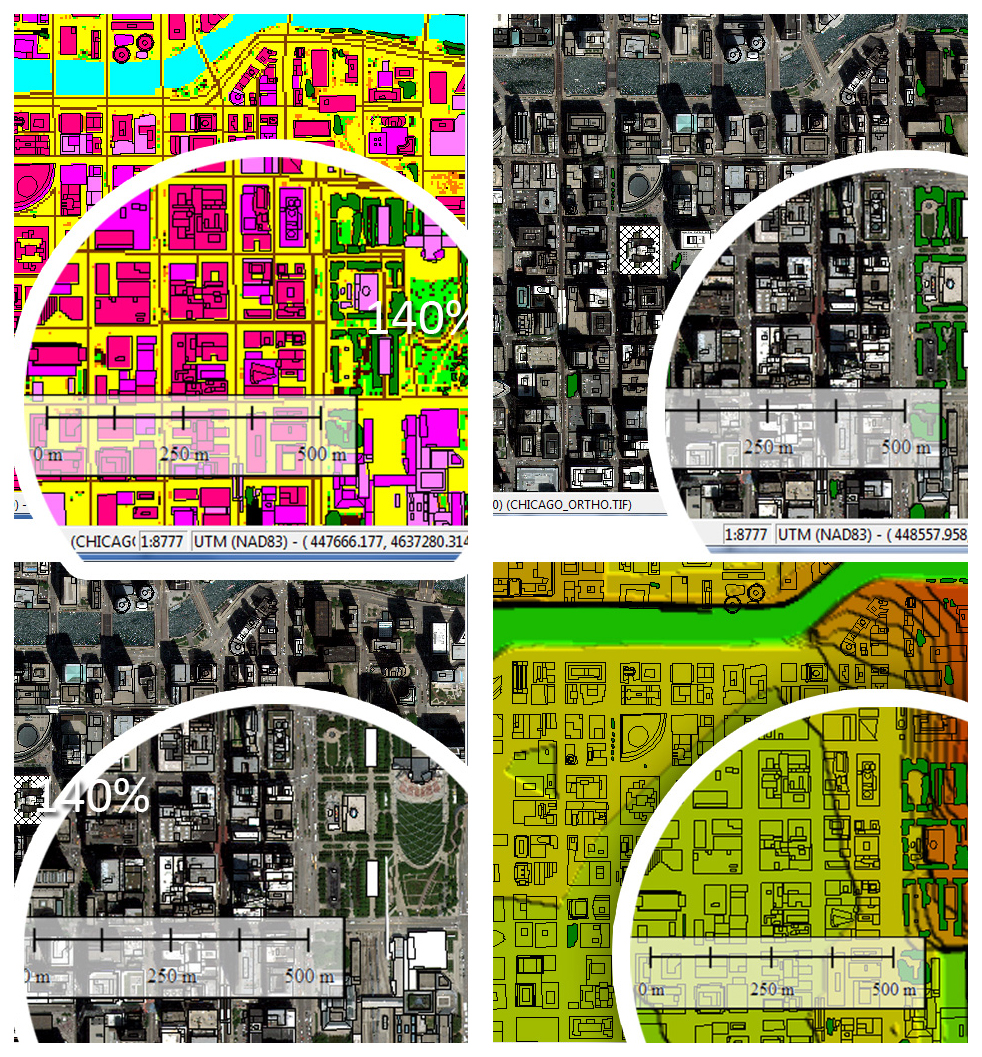
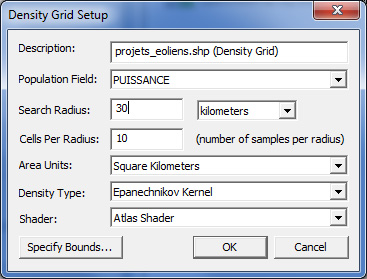
then i measured it visually using a density grid in Global Mapper. Create density Grid.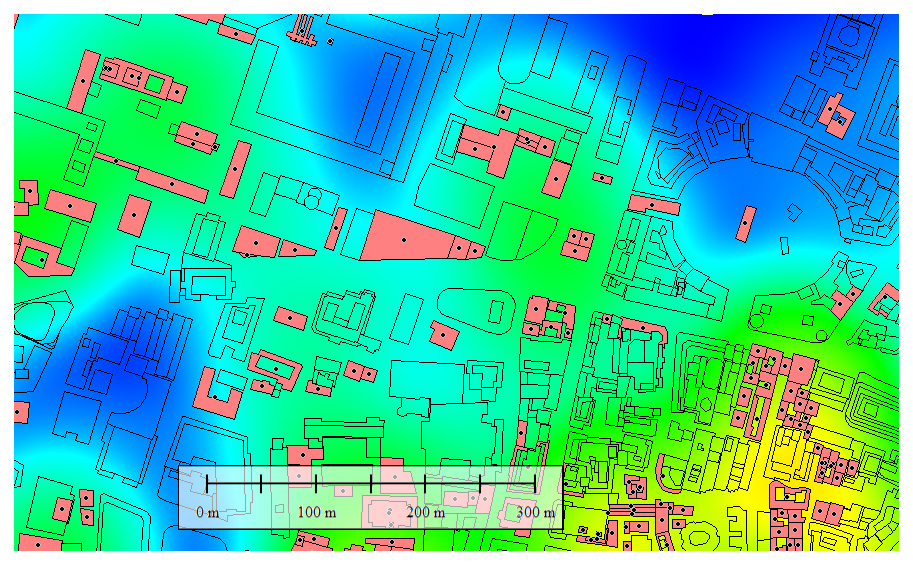
And finally measured the RMSE by opening the table in excell format and usign the actual formula for extracting RSME values:
= SQRT(SUMSQ(M1:Mn)/COUNTA(M1:Mn)) —> Note this formula is only valid for this case. You’d need to update Mx values using yours:-)
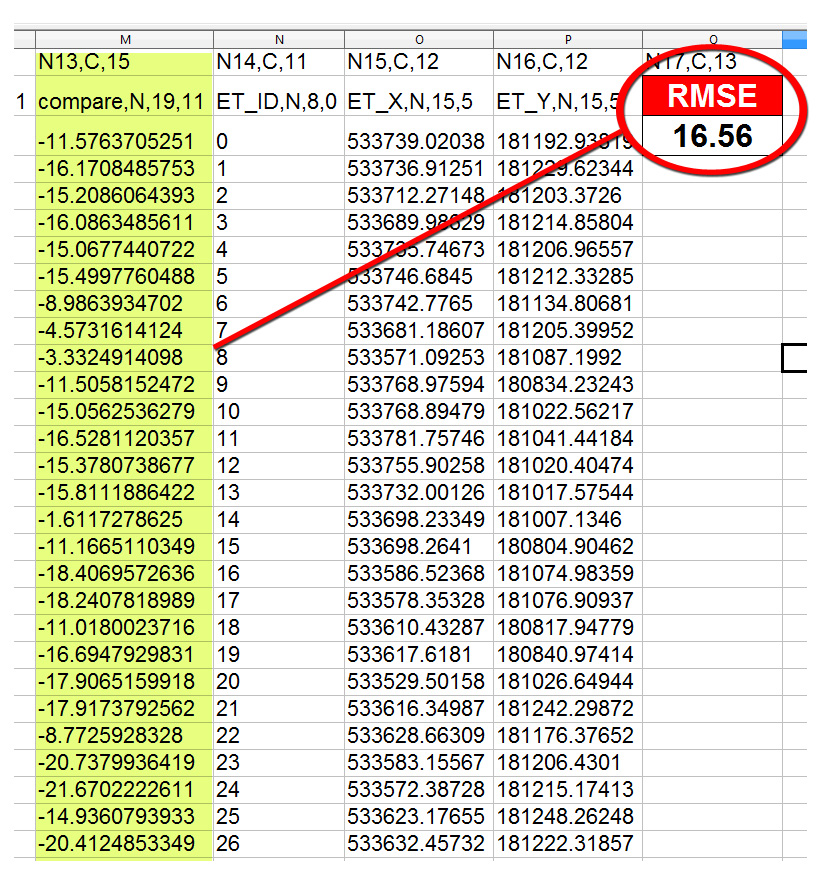
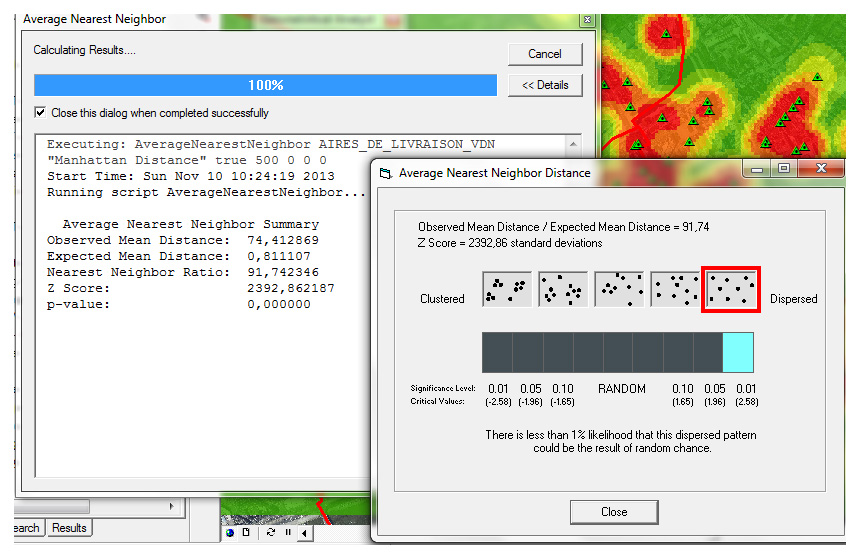
Wow! a very high value. Does this value corresponds to our accuracy figures? Yes? No?.
Now it’s the time for decission makers to bring into action!
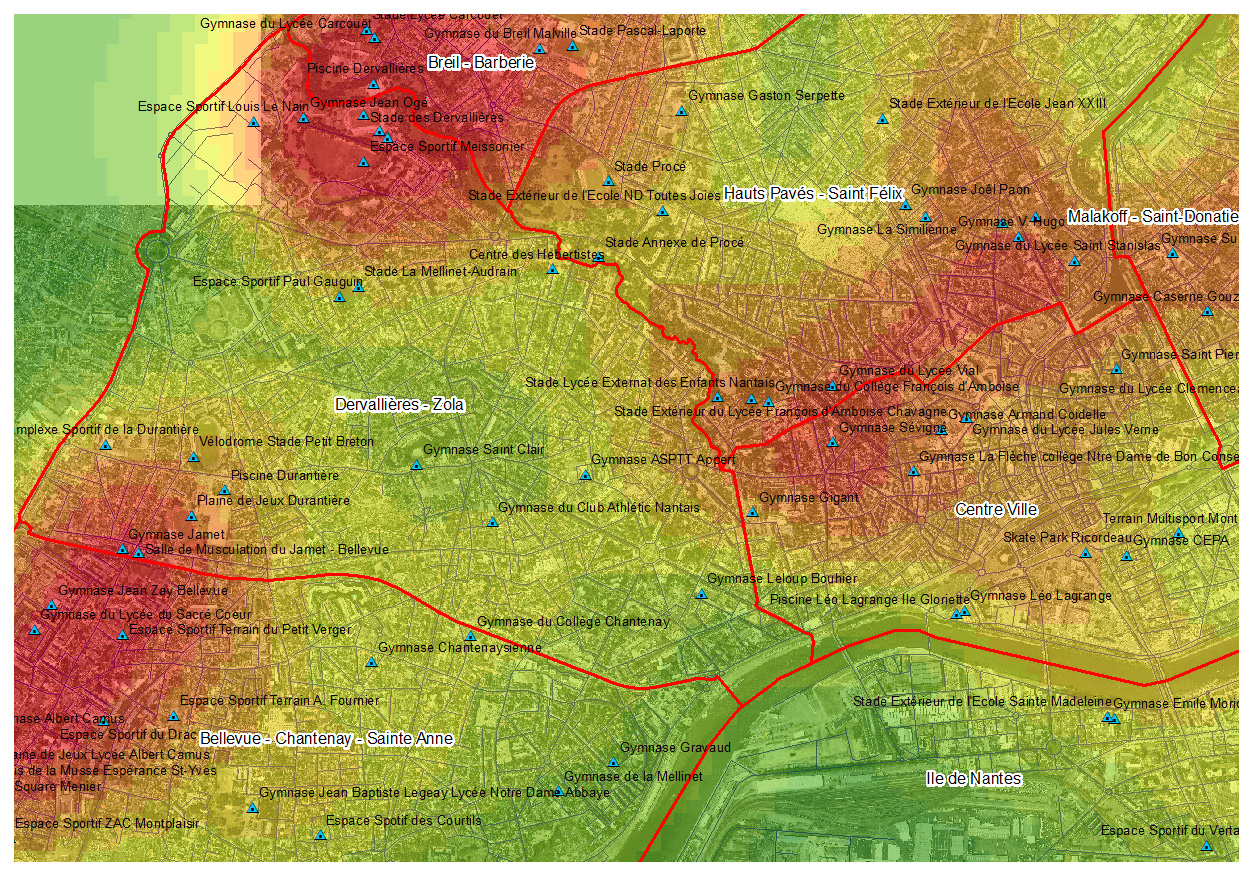
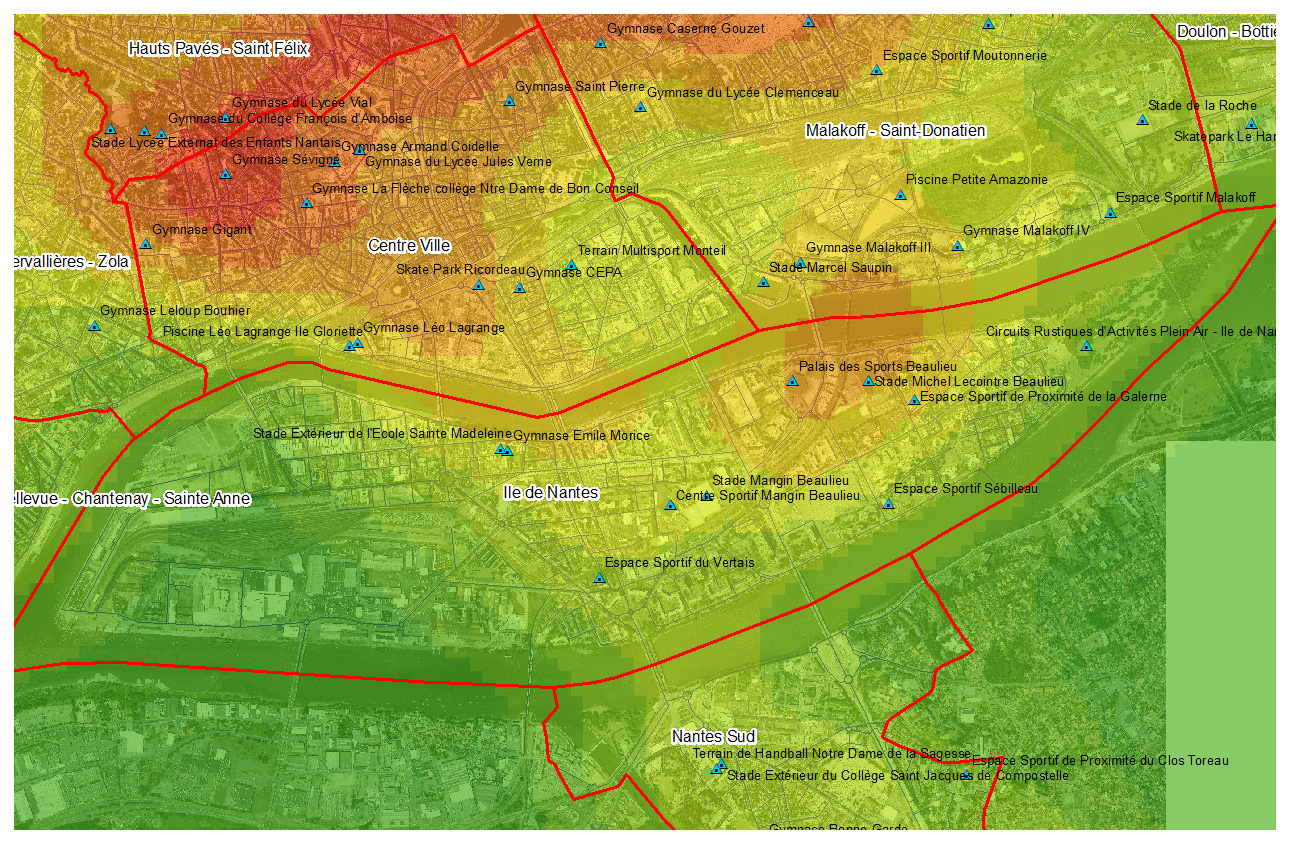
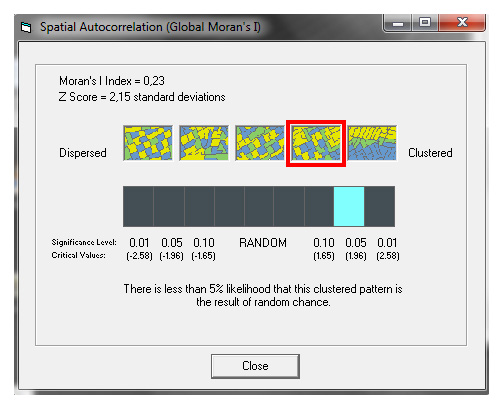
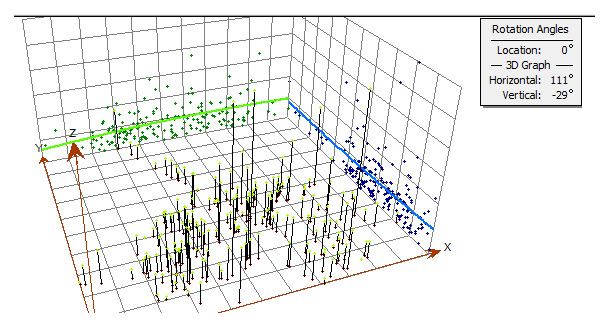
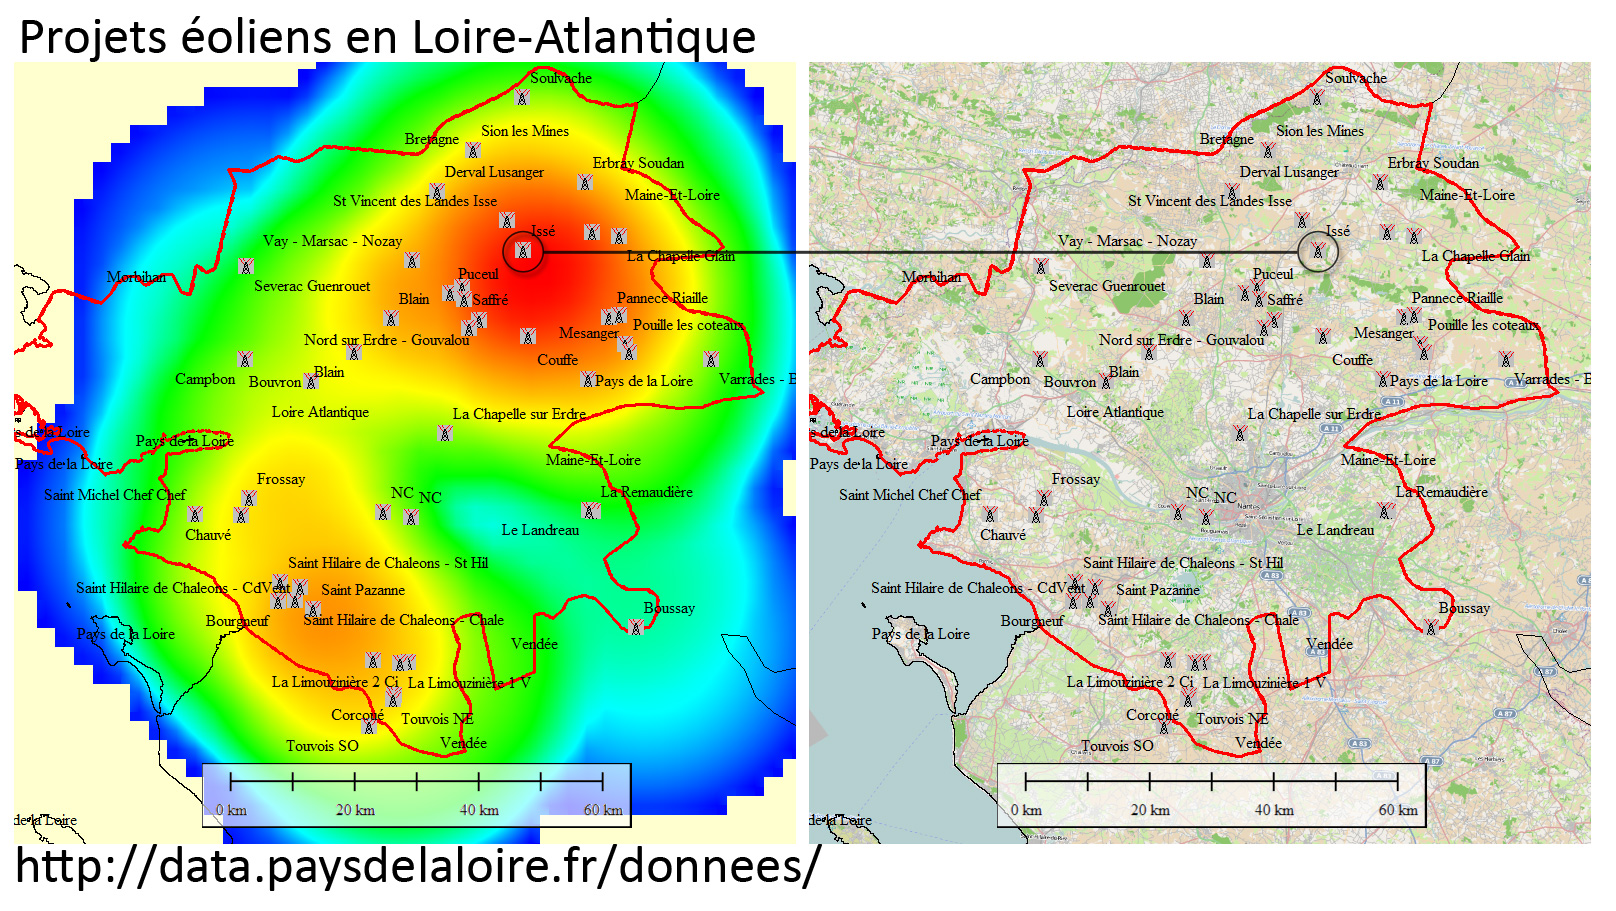
And what about some geostatistical analysis. I performed this using North East Trends in ArcGis. We can see from West to East there’s no variation but we can see it increases the error the further the south…
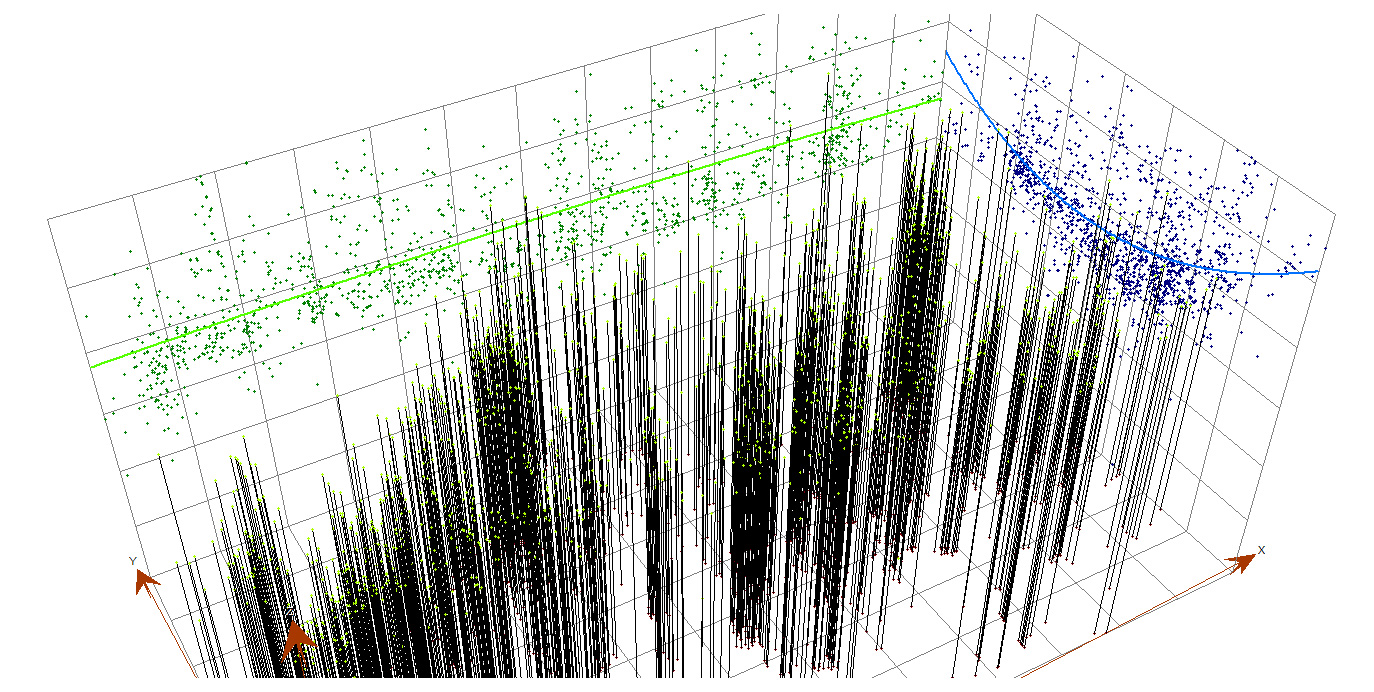
So this is the area concentrating the higher differences comparing both datasets.
Hope you liked the analysis, if so…share!!!!

Alberto C.
MSc GIS