
Recibí este link por Facebook hace un rato (Gracias Paco!)… https://hoyodecrimen.com/mapa#/19.4052/-99.0987/12 y me dediqué unos minutos a analizar un hecho puntual, el homicidio doloso, en un periodo concreto de tiempo, de 2013 a 2015. Veamos la previsualización de todos los homicidios ocurridos en 2013 en CARTO. El autor de la página llamada CRIMEN POR TUContinue reading “Homicidio doloso en Ciudad de México 2013-2015”
Tag Archives: GIS
Euclidean allocation analysis II

Imagine you need to promote recycling. Imagine you have 1000 inhabitants from a small village and you need to provide proper colored plastic bags for each and every one of the categories you need to disaggregate: organic, plastic and paper. You need to service them all properly but you can only choose 5 shops (out of theContinue reading “Euclidean allocation analysis II”
Creating value through Open Data

The benefits of Open Data are diverse and range from improved efficiency of public administrations, economic growth in the private sector to wider social welfare (Source: http://www.europeandataportal.eu/) Performance can be enhanced by Open Data and contribute to improving the efficiency of public services. Greater efficiency in processes and delivery of public services can be achieved thanks toContinue reading “Creating value through Open Data”
Descargas del CNIG. Open Source bien hecho!

Hola amigos del GIS, Por motivos de trabajo que no vienen al caso, he tenido que bucear de manera sistemática la web de descargas del CNIG. http://centrodedescargas.cnig.es/CentroDescargas/inicio.do Una maravilla. Por motivos que tampoco viene al caso, he de hacer esto mismo de vez en cuando en todos los Institutos cartográficos del mundo y el delContinue reading “Descargas del CNIG. Open Source bien hecho!”
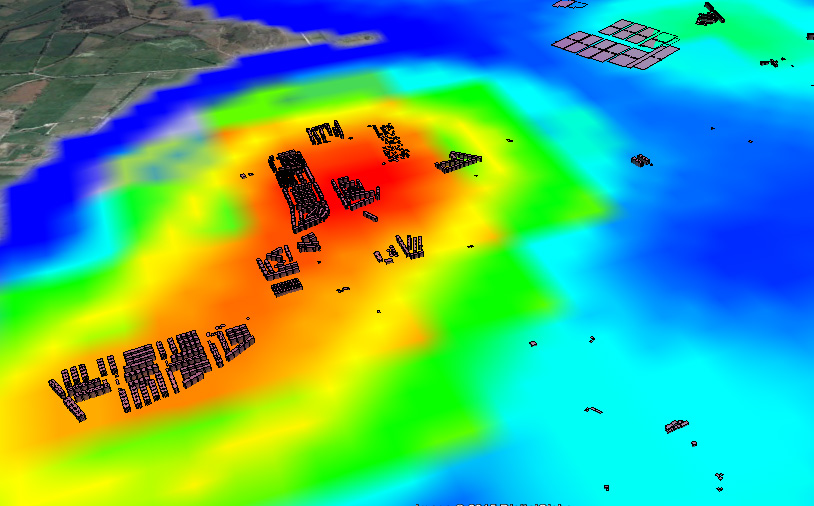
Risk exposure. Geoprocessing using Open Source Data!! Next steps!!
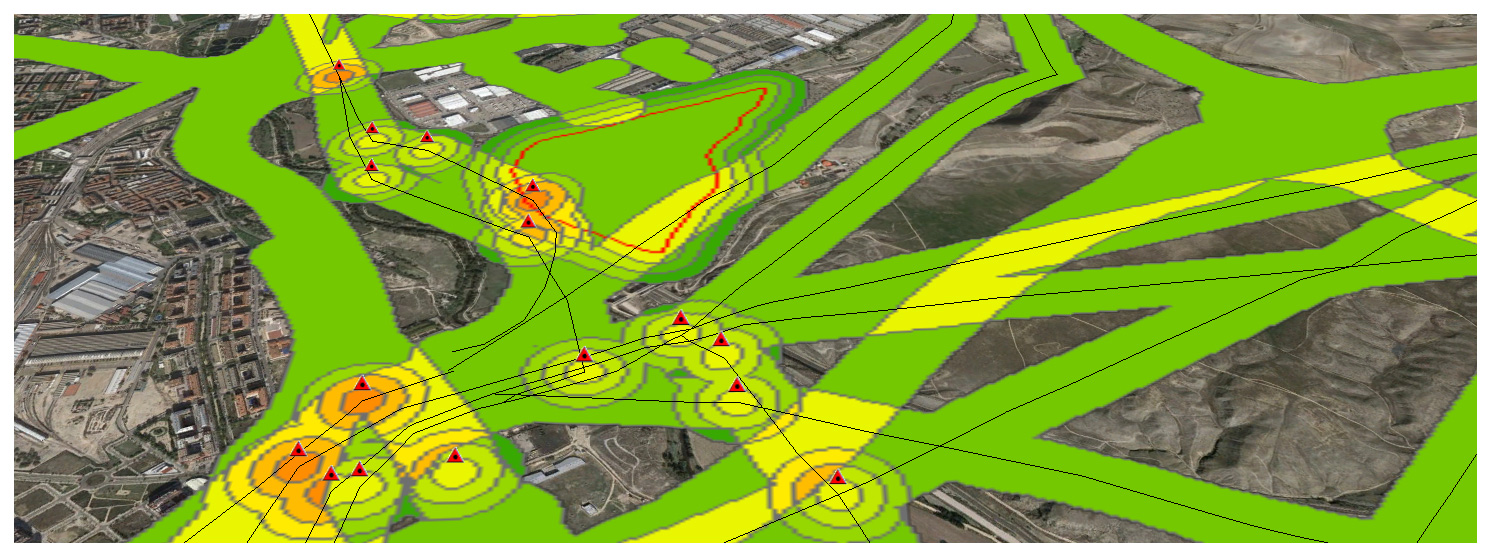
Now that we have completed a first example, let’s continue with a real-world one. Its important working on a Data Model to define what we understand as a Risk and how important this is. Meaning. High voltage power lines are an actual risk but the closer we are, i guess the bigger the risk is, meaning i.e 3 if we are within 50m and 1 if we are 150m away… It’s only a guess.
Risk exposure. First steps

Knowing how to geoprocess features is key if what we want is assesing risk exposure. What’s a risk? Which are the risks? Where are the risks? How important a risk is?
Jugando con CartoDB

Hace ya mucho tiempo que he oído hablar de CartoDB y que vengo practicando en su página web a visualizar bases de datos sencillas. Crea una cuenta Incorpora tus datos o tómalos de la galería Selecciona en modo datos la columna que quieres simbolizar/visualizar Conviértela en NUMBER si estuviera en STRING Selecciona en modo mapaContinue reading “Jugando con CartoDB”
Change detection – Detección de cambios en polígonos
THE PROCEDURE: Centroids of buildings; Spatial join showing presence-absence, considering a 10m accuracy threshold, meaning if the centroid has not moved more than 10m, its the same building. If the centroid in 2012 is not in 2014, its considered as demolished. If a new centroid appears its considered new building.
La geográfica cabecera de ‘Up in the air’ con George Clooney
Para alguien que maneja mapas a diario es una sorpresa interesante cruzarse con esta cabecera de la película de Jason Reirman protagonizada por George Clooney ‘Up in the air’. Nubes, campos de cultivo, ciudades en 2D, 3D. Qué bien he elegido mi profesión:-) Para alguien que viaja mucho, salvando las distancias, este vídeo, también delContinue reading “La geográfica cabecera de ‘Up in the air’ con George Clooney”
Tipologías usuarios Madrid Río. Estadísticas y tendencias interesantes
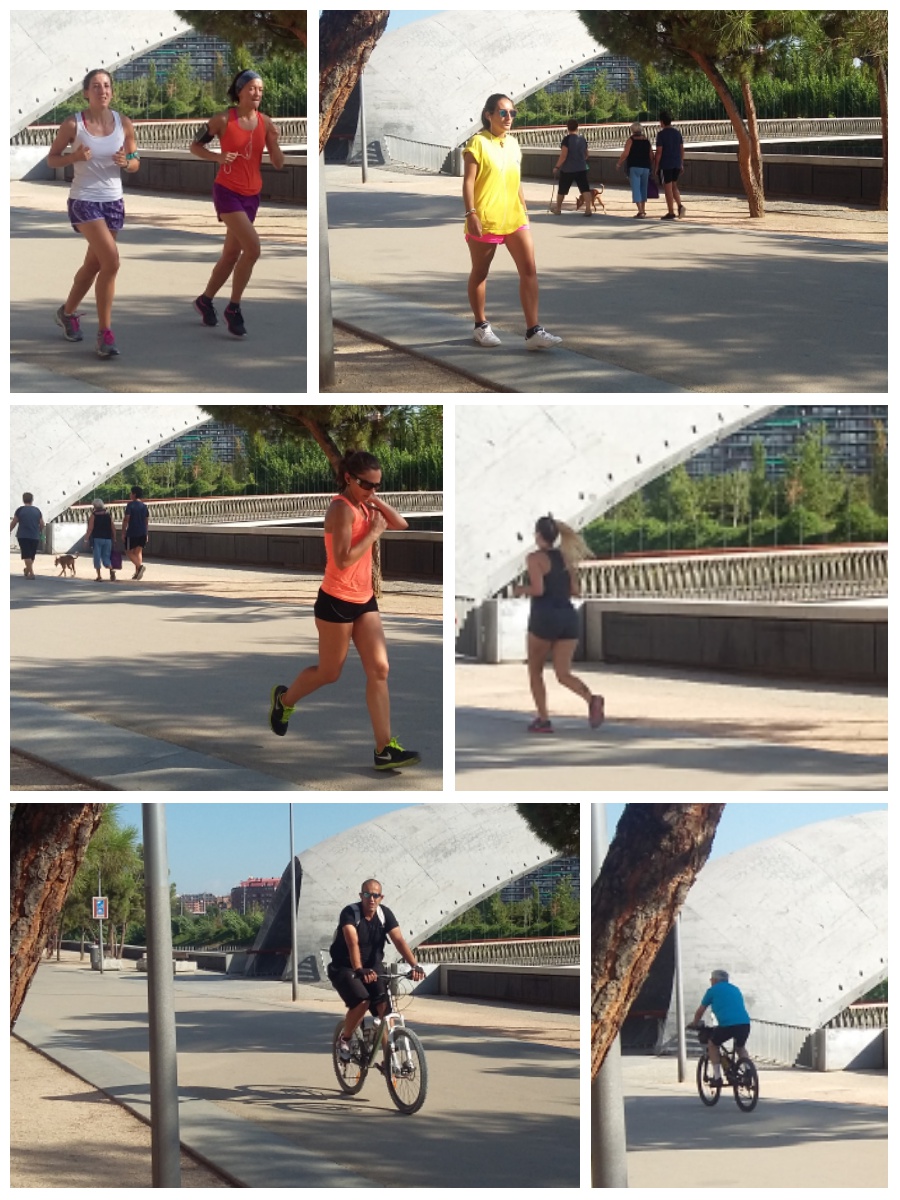
Para la multitud de personas a las que como a mí, les ha sorprendido esta infrastructura en frente de sus casas hay posibilidad de encontrarse en el mismo metro cuadrado a alguien corriendo, alguien andando, una pareja con un carrito de niños, unos amigos en patines, alguna persona en bici… unos más rápido y unos más lento, todos hemos de convivir en un trazado de unos 7,5km de largo y no más unos metros de ancho, con lo que unas mínimas normas de circulación se imponen.
