I have already worked as a building cleaner, data capture operator, copywriter, photographer, graphic designer, video editor, technical salesman… and seriously, I think i’m too old to make a living in something else now… GIS has been working for me the last 8 years and i want to stay like this!!!:-) I have just read inContinue reading “Visualization will endure these difficult years of CRISIS!!”
Tag Archives: GIS
Cool data. What is this?
What is this ‘cool data‘ all about?. When i got my degree in Geography (about 15 years ago) it didn’t make sense at all being interested in something like graphic design, photography, video and all this stuff… but not only interested in my leisure time but also for taking advantage of it, getting a lifeContinue reading “Cool data. What is this?”
Projets éoliens en Loire-Atlantique
C’est vraiment magnifique l’ouverture des données publiques… Je vais décrire mon itinéraire pour mieux comprendre: Télécharger des données (Projets éoliens en Loire-Atlantique) Telecharger DTM (SRTM v4) Faire Carte d’ombrage (ArcGIS), Orientations (ArcGIS) et Inclinations (ArcGIS) pour mieux comprendre l’emplacement des moulins Faire Carte de densité (en mesurent la puissance du parc) Et maintenant la carte de densité en Global Mapper…Continue reading “Projets éoliens en Loire-Atlantique”
Coverage map video over Bogotá, Colombia
A few months ago i prepared some scenarios over the city of Bogotá. Hope you guys like it.
Solar + Shadows analysis on Rue Massillon, Nantes (France)
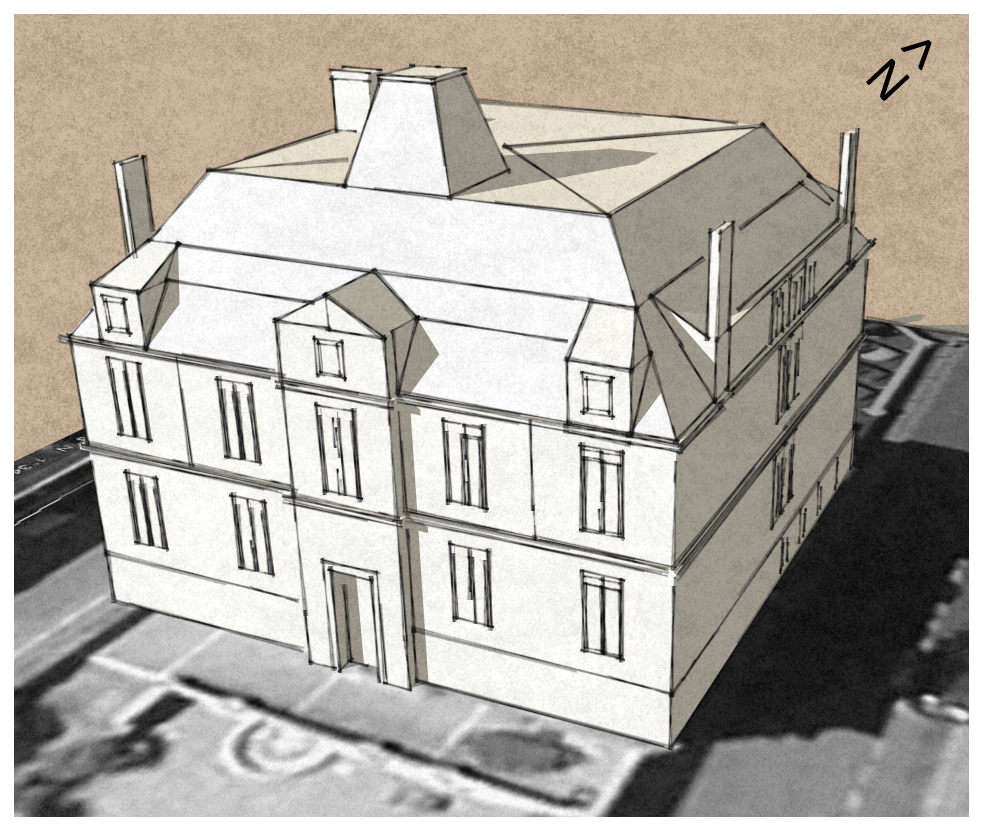
Let’s model it first using Sketchup. Also I have used a non standard style only for visualization purposes
Shadow analysis en Puerta de Arganda, Madrid.
Hoy publico en español puesto que los datos son en español y yo soy español:-) but if you guys have any doubt dont hesitate to ask… even if you are french I will be around to answer you back “en français”, quand même !!!. La idea era hacer un estudio de sombras de para mi propio usoContinue reading “Shadow analysis en Puerta de Arganda, Madrid.”
On va déménager alors… Analyse solaire !!!
Ma copine et moi on va nous déménager très bientôt alors il faut faire une analyse solaire. Nantes, la ville ou on habite est connue dans le monde entier pour ses niveaux de pluie, n’importe que ce soit été, printemps… meme si France Météo a dit qu’il va faire BEAU… A Nantes ça ne marcheContinue reading “On va déménager alors… Analyse solaire !!!”
Vulnérabilité de la population – Analyse SIG
Voici un ancien analyse accompli il y a long temps mais toujours d’actualité. En espagnol.
Architectural models and some fun
I started sketching this building across the street and decided to include some funny pseudo 3D pictures of my girlfriend and myself… Architectural modelling is easy using Sketch-up. This model took me about 5 hours work (during the weekend, shame!), using components, texturing, handling scenes and exporting/editing Video. Hope you guys like it.
County of Scotland (North Carolina, US) GIS Cartography
One more video i recorded long ago on geoprocessing Cartography. Landuse, DTM, etc. Hope you like it.
