Do these two variables have a correlation?. To answer this important question first of all we have to know that only if it’s a linear relationship and there are no outliers we can take advantage of Mr Pearson’s correlation statiscal tool. If i love chocolate, does this mean i have tendency of being chuby? orContinue reading “Pearson correlation and GIS”
Category Archives: Flujos de trabajo /workflows
Cool data. What is this?
What is this ‘cool data‘ all about?. When i got my degree in Geography (about 15 years ago) it didn’t make sense at all being interested in something like graphic design, photography, video and all this stuff… but not only interested in my leisure time but also for taking advantage of it, getting a lifeContinue reading “Cool data. What is this?”
Projets éoliens en Loire-Atlantique
C’est vraiment magnifique l’ouverture des données publiques… Je vais décrire mon itinéraire pour mieux comprendre: Télécharger des données (Projets éoliens en Loire-Atlantique) Telecharger DTM (SRTM v4) Faire Carte d’ombrage (ArcGIS), Orientations (ArcGIS) et Inclinations (ArcGIS) pour mieux comprendre l’emplacement des moulins Faire Carte de densité (en mesurent la puissance du parc) Et maintenant la carte de densité en Global Mapper…Continue reading “Projets éoliens en Loire-Atlantique”
Solar + Shadows analysis on Rue Massillon, Nantes (France)
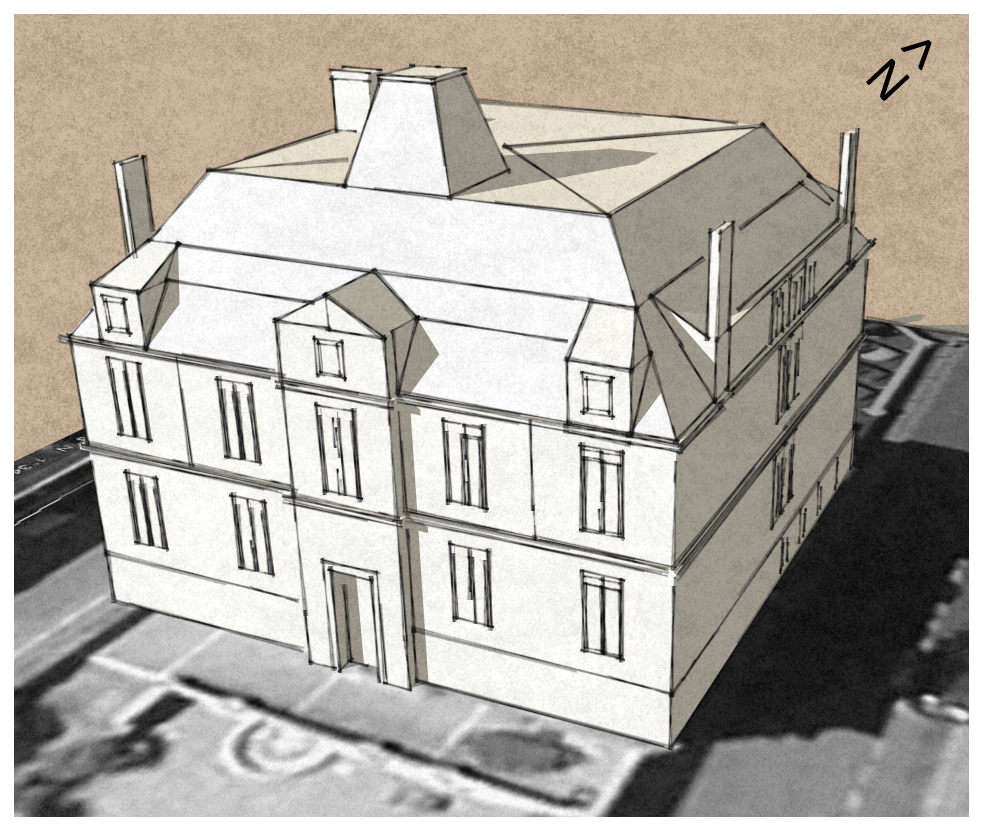
Let’s model it first using Sketchup. Also I have used a non standard style only for visualization purposes
ViewTec’s State-of-the-art 3D visualization
Good news!!!! They’ve probably released this Geovisualization Engine long time ago (It used to be an ‘in-house’ software) but I have just realized. I worked with this state-of-the-art TerrainView 3D software for six months while I was working as a GIS Specialist in Cape Town (South Africa)… What does this software has that no oneContinue reading “ViewTec’s State-of-the-art 3D visualization”
Visualizing LAS LIDAR data with sketch-up
While trying to figure out the way to get a 3D model from raw Lidar data, I first opened my LAS file in Global Mapper, exported it to DXF, imported then into Sketch-up and after recording a few scenes, I saved the animation… this is it!. Alberto
Using Excel to calculate the RMSE for LiDAR vertical ground control points

The height accuracy of the collected LiDAR data can be verified by comparing with independently surveyed ground control points on hard, flat, open surfaces. It is essentially just calculating the height differences for all the control points and then determining the height root mean squared error (RMSE) or differences. Most LiDAR processing software have the reporting function built-in. However, plain Microsoft Excel can also do the job (except for extracting the elevation from the LiDAR data).
Data acquisition: How do I know if this river is been well acquired?
I’ve already entered my river but my imagery was in 2D so… was it well acquired?… First of all, I import my shape (shp) file into Global Mapper (what a great sofware!) and export my vector file as a KML. Import my river.kml file into my brand new Google Earth 5.2 or just double-click itContinue reading “Data acquisition: How do I know if this river is been well acquired?”
The SketchUp 3D API: Working with 3D geospatial data
I hereby post this video by Matt Lowrie (Google). hope it’s interesting for you guys. Alberto
Ever tried Google Earth 3D Building Maker?
I started modelling 3D buildings quite a few years ago, I used to use 3D StudioMAX… After almost forgetting everything i knew about modelling, 3D and so on Sketch up was released by Google. In a few days i was not just making demos but working and producing!!! Its extremly easy!!!!. Now They have justContinue reading “Ever tried Google Earth 3D Building Maker?”

