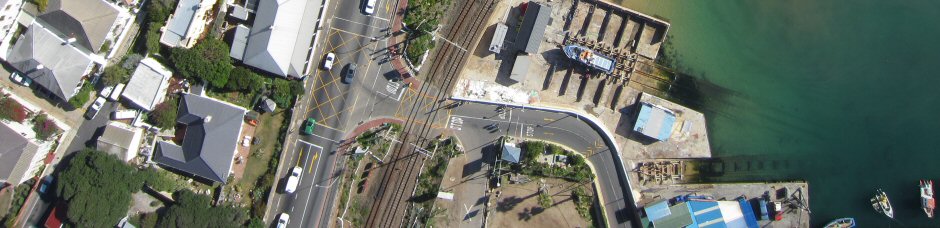
I have started using this visualization engine to overlay standard ortho imagery, DTM datasets and telecomunication specific datasets… All i can say so far is that it works pretty well!!!. Being able to understand the scope of land use dataset while we swipe different types of images… it works!!
In this particular case a land use classes menu was added so we can easily identify every one of the different types of coverages at the same time we visualize the background we have used to extract that information.
Please don’t hesitate to make questions about it,
Regards,
It was 2007 when i finished my master’s degree and wanted to show some videos of procedures. At that moment in time i wanted to find a job -any job- involving GIS and i finally found it dealing with the Geovisualization department within a GIS company… now i happen to deal with DEMs. DTM, etc on a daily basis which is great!!. I hereby show you that video.
The most efficient way to monitor our environment is from above. Traditionally, aerial photography and mapping is a costly and time consuming business. However, by using our UAV technology, we are able to offer a cost and time effective solution for your aerial photography and mapping needs. Obtaining high resolution Orthorectified image mosaics and Digital Elevation Models has never been this easy.
Q: Can the UAV fly in all weather conditions?
A: Technically, our UAV can fly with winds up to 7 m/s (i.e. moderate breeze), in low-visibility conditions, or even at night. Although light rain will usually not affect its flight characteristics, the swinglet is not water-proof and should therefore not be used when raining or snowing. For best image quality, the UAV should be used on clear days with light wind (up to 5 m/s, i.e. a normal breeze is fine).
Q: What are the specifications of the camera used in the UAV?
A: The UAV is equipped with a 12 MP compact camera with a focal length of 24 mm (in 35-mm equivalent). The resulting ground resolution is adjusted by choosing an appropriate flight altitude (typically between 50 and 1000 metres above ground) and will range from 2 to 40 cm/pixels.
Q: What is the area that can be typically imaged during one flight?
A: This depends on the flight altitude (and thus the ground resolution): At 140 m (ground resolution of 5 cm/pixel), one picture covers 0.03 square km (3 ha, 7 acres) and one flight covers up to 1.5 square km (150 ha, 370 acres). * At 280 m (ground resolution of 10 cm/pixel), one picture covers 0.12 square km (12 ha, 29 acres) and one flight covers up to 4 square km (400 ha, 990 acres). * At 840 m (ground resolution of 30 cm/pixel), one picture covers 1.07 square km (107 ha, 265 acres) and one flight covers up to 10 square km (1000 ha, 2470 acres).
Q:What are the flight performances of the UAV?
A: The UAV has a flight endurance of about 30 minutes with a fully charged battery. The endurance is reduced with wind, frequent altitude changes or very low temperatures. The cruise speed is 10 m/s (36 km/h, 22 mph). The climb rate is about 3 m/s. The maximum wind speed is 7 m/s (25 km/h, 16 mph), which corresponds to a moderate breeze. This includes a safety margin to allow the UAV to fly back home automatically when strong wind is detected by the autopilot.
Q: How many images can be taken during one flight?
A: When photos are triggered at maximum rate (every 3-4 seconds), the number of images in one flight can reach 400. The provided onboard memory card has more than enough space to store such a number of images at full resolution.
Q: What level of accuracy should be expected?
A: The accuracy of the orthomosaics and the digital elevation models (DEM) strongly depends on the flight height, lighting conditions, availability of textures, image quality, overlap, and type of terrain. In standard conditions (flying at 100-150 meters above natural terrains with 50 to 70% image overlap), a relative accuracy of 10 cm and an absolute accuracy of 3-5 meters is obtained without the use of Ground Control Points (GCP). However, GCP’s can be introduced, reducing the absolute error to the level of a few centimeters.
Good news!!!! They’ve probably released this Geovisualization Engine long time ago (It used to be an ‘in-house’ software) but I have just realized. I worked with this state-of-the-art TerrainView 3D software for six months while I was working as a GIS Specialist in Cape Town (South Africa)… What does this software has that no one of other softwares I know have????. Rain, snow, clouds, wind… Athmosferic conditions!!!! A very reliable package… I have just uploaded a video rendered directly from a pre-recorded flight path… I will try to make my own while I work with this personal license key they have provided me for one month… Here it is!!. Hope you like it mates!.
TerrainView™ is the free entry visualization product of ViewTec. TerrainView™is an easy to use viewing tool and 3d editor capable of displaying the most popular 3d formats. It offers walk-through capabilities in real-time.TerrainView Extensions
Upgrade the free TerrainView product online to the different professional extensions:
TerrainView-Globe™ extends TerrainView with unlimited GIS, multilayered elevation and image data import based on Earth and offers ultra-fast and high resolution rendering for GIS and simulation users.
The extension TerrainView-CMAX™ consists in a high-end system for seamless multi-channel, multi-projectionsand visualizations on multiple screens and walls.
In the City of Baltimore, the decades-old infrastructure consists of 2,000 miles of roads, 300 bridges and culverts, 7,600 miles of water pipes, storm water drains and wastewater lines, and 3.7 million feet of conduit. Washington Gas serves more than one million residential, commercial and industrial customers throughout the Washington, DC metropolitan area. What they have in common are significant challenges working in the Right of Way.
Join us for a complimentary and informative webinar on Wednesday, September 15, and hear two case studies on new technology deployed by utility companies and government agencies to manage real-time, coordinated planning of repairs to aging infrastructure.
This web-based, centralized, map-driven technology provides for the timely exchange and coordination of construction and maintenance projects online while:
• Reducing construction and paving costs
• Providing better information with which to make operational decisions
• Avoiding the headaches of poorly timed projects and the resulting cost overruns
• Solving the problem of paving streets shortly before a series of planned utility cuts
REGISTER NOW
In the City of Baltimore, the decades-old infrastructure consists of 2,000 miles of roads, 300 bridges and culverts, 7,600 miles of water pipes, storm water drains and wastewater lines, and 3.7 million feet of conduit. Washington Gas serves more than one million residential, commercial and industrial customers throughout the Washington, DC metropolitan area. What they have in common are significant challenges working in the Right of Way.
Join us for a complimentary and informative webinar on Wednesday, September 15, and hear two case studies on new technology deployed by utility companies and government agencies to manage real-time, coordinated planning of repairs to aging infrastructure.
This web-based, centralized, map-driven technology provides for the timely exchange and coordination of construction and maintenance projects online while:
• Reducing construction and paving costs• Providing better information with which to make operational decisions• Avoiding the headaches of poorly timed projects and the resulting cost overruns• Solving the problem of paving streets shortly before a series of planned utility cuts
While trying to figure out the way to get a 3D model from raw Lidar data, I first opened my LAS file in Global Mapper, exported it to DXF, imported then into Sketch-up and after recording a few scenes, I saved the animation… this is it!.
The height accuracy of the collected LiDAR data can be verified by comparing with independently surveyed ground control points on hard, flat, open surfaces. It is essentially just calculating the height differences for all the control points and then determining the height root mean squared error (RMSE) or differences. Most LiDAR processing software have the reporting function built-in. However, plain Microsoft Excel can also do the job (except for extracting the elevation from the LiDAR data).
Assuming that you are able to calculate the height differences for all the control points and place in a spreadsheet as shown in the figure below. I have a column of delta Z values in column A.
Then to calculate the RMS value for the elevation differences, I can do the following.
In a cell, type in the formula:= SQRT(SUMSQ(A2:A18)/COUNTA(A2:A18))where A2:A18 are the values from cell A2 to A18 in the spreadsheet. Simply replace these with the actual locations on your spreadsheet.
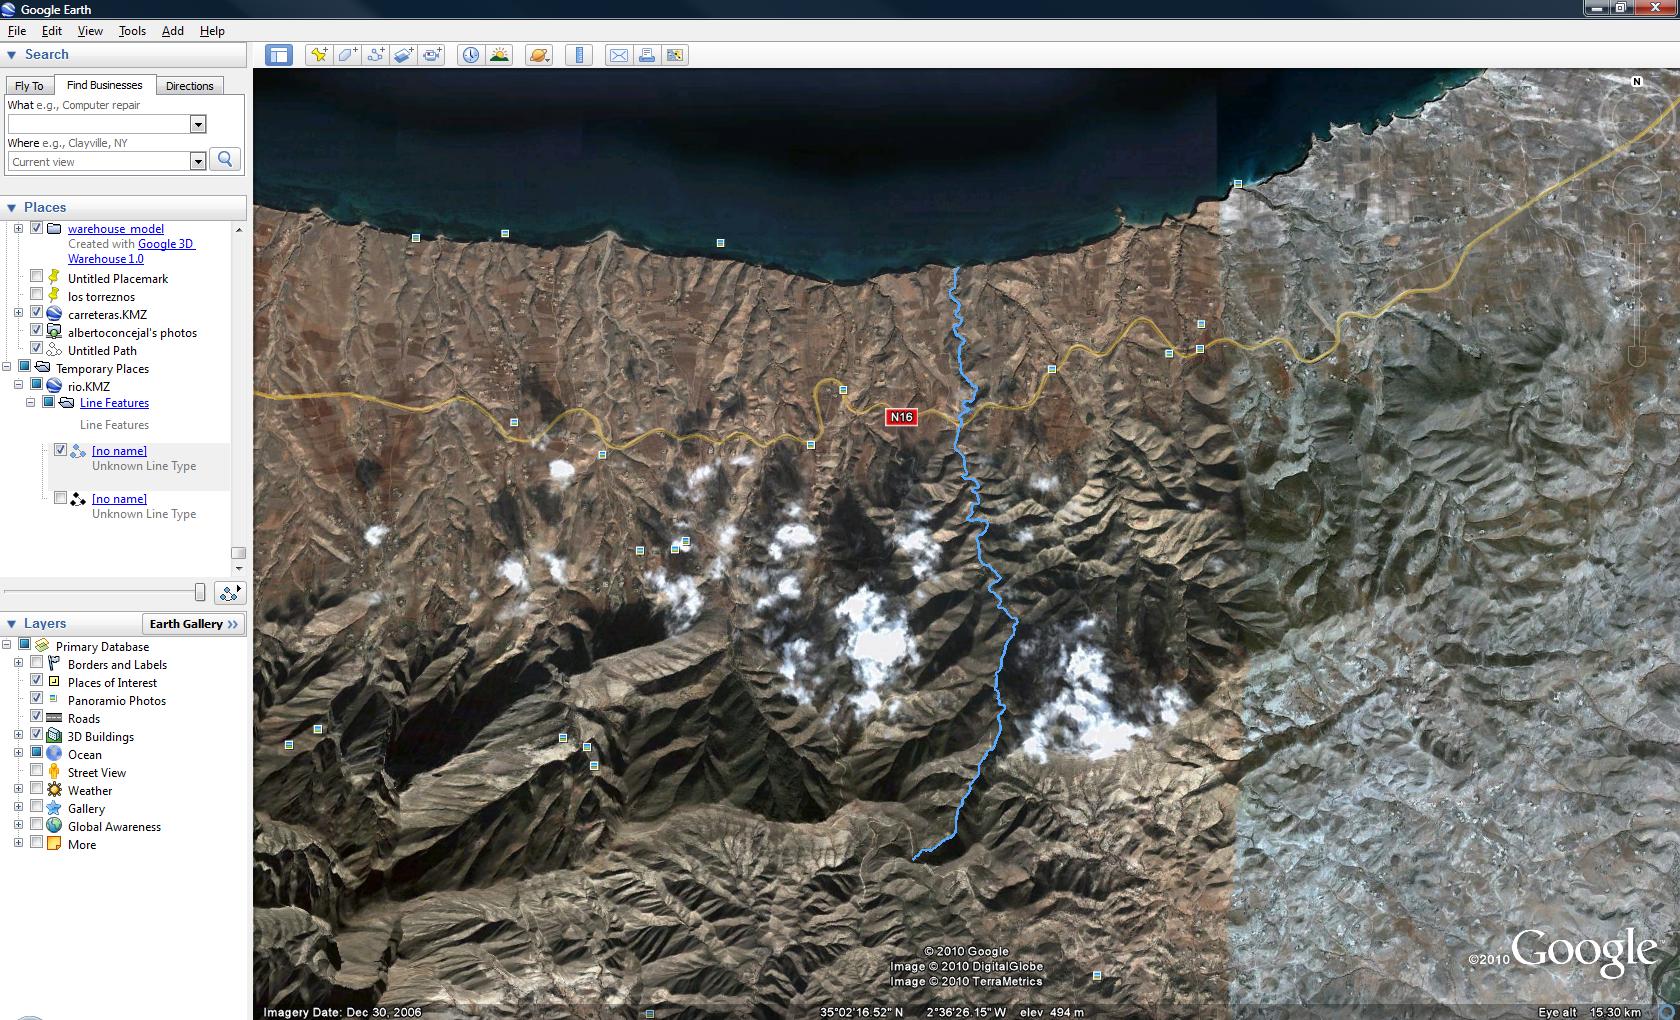
I’ve already entered my river but my imagery was in 2D so… was it well acquired?… First of all, I import my shape (shp) file into Global Mapper (what a great sofware!) and export my vector file as a KML.
Import my river.kml file into my brand new Google Earth 5.2 or just double-click it in his location… easyest impossible!.
Select it and use ‘show elevation profile’, a very useful new tool for these purposes…
And that’s it, constant altitude, almost perfect!.