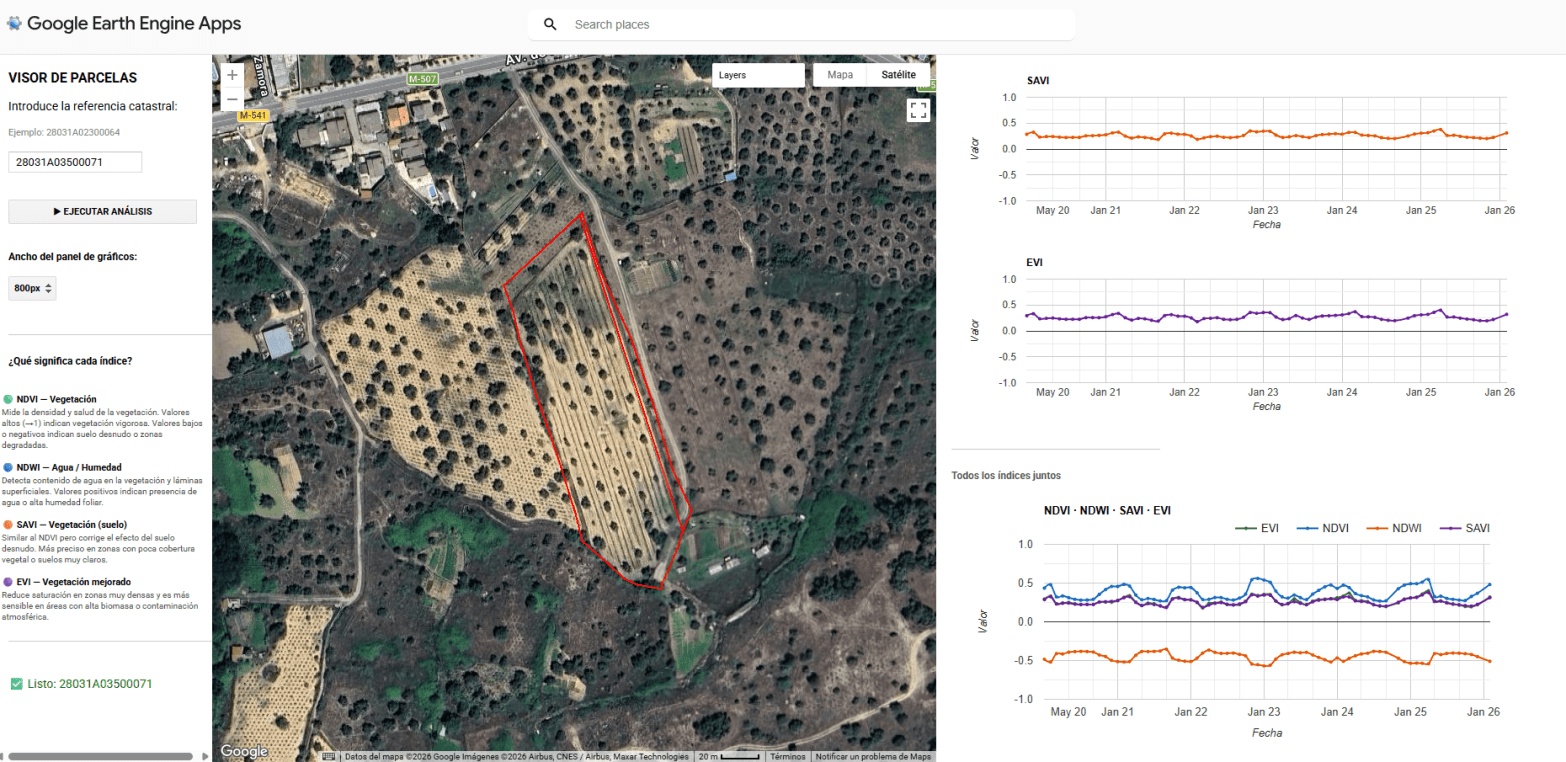
La convergencia entre el Big Data geoespacial y la administración pública ofrece una oportunidad sin precedentes para la optimización agronómica. La capacidad de procesamiento de Google Earth Engine (GEE), vinculada a la cartografía vectorial del Catastro rural, permite transformar las series temporales de misiones como Sentinel-2 en herramientas de diagnóstico directo sobre la parcela. Este enfoque desplaza el análisis de una observación puramente visual a una monitorización cuantitativa basada en la respuesta espectral de los cultivos. El núcleo de esta aplicación reside en la intersección geométrica de las parcelas catastrales con colecciones de imágenes multiespectrales. Mediante el uso de la API de JavaScript en GEE, se automatiza el cálculo de indicadores biofísicos críticos como el NDVI (Índice de Vegetación de Diferencia Normalizada), el NDWI (Índice de Agua de Diferencia Normalizada), el EVI (Índice de Vegetación Mejorado) y el SAVI (Índice de Vegetación Ajustado al Suelo). Estos índices no solo reflejan el vigor fotosintético, sino que permiten identificar anomalías de crecimiento, estrés hídrico o variaciones en la densidad foliar que son invisibles al ojo humano en las fases tempranas del ciclo fenológico.
Category Archives: Visualization Engine
Super-résolution 1 m a Cadalso de los Vidrios, Madrid avec Sentinel 2 (10m). Magique !
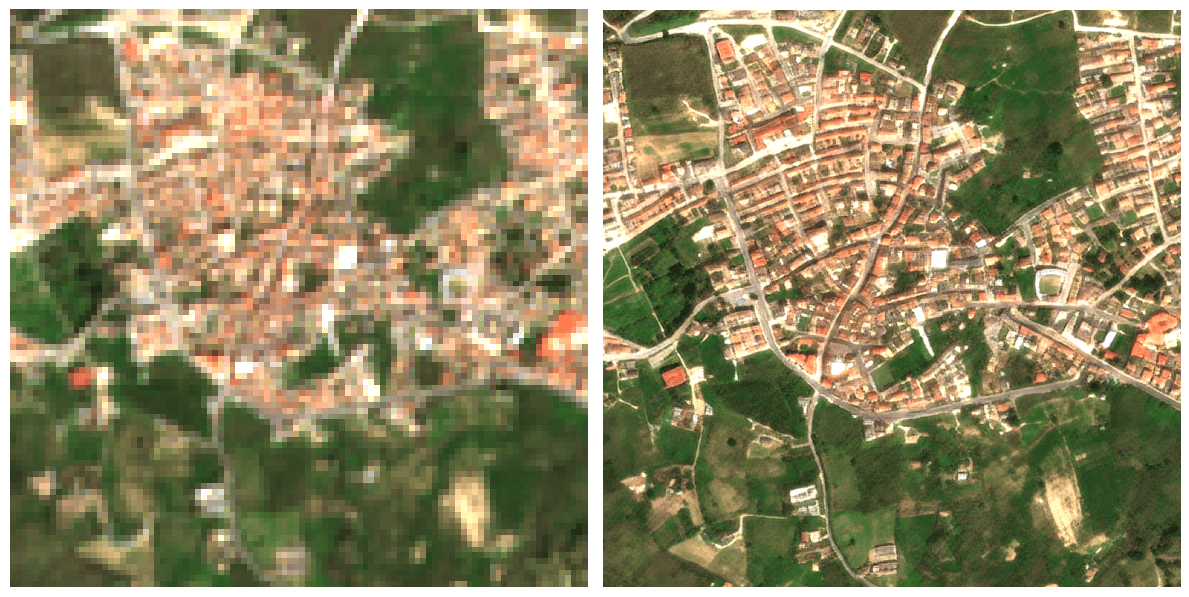
Passer d’une résolution de 10 mètres à 1 mètre change radicalement la perspective du suivi agricole : on ne regarde plus une parcelle dans sa globalité, on observe ce qui se passe à l’intérieur même des rangs de culture. Ce saut qualitatif est possible grâce à l’algorithme S2DR3, un modèle de Deep Learning qui ne se contente pas d’agrandir les pixels, mais reconstruit l’information manquante. En s’appuyant sur les corrélations entre les différentes bandes spectrales de Sentinel-2 et en s’entraînant sur des images de très haute résolution, l’IA parvient à synthétiser une image à 1 m/pixel d’une précision étonnante.
Aventuras y desventuras de un geógrafo en “desarrollo”
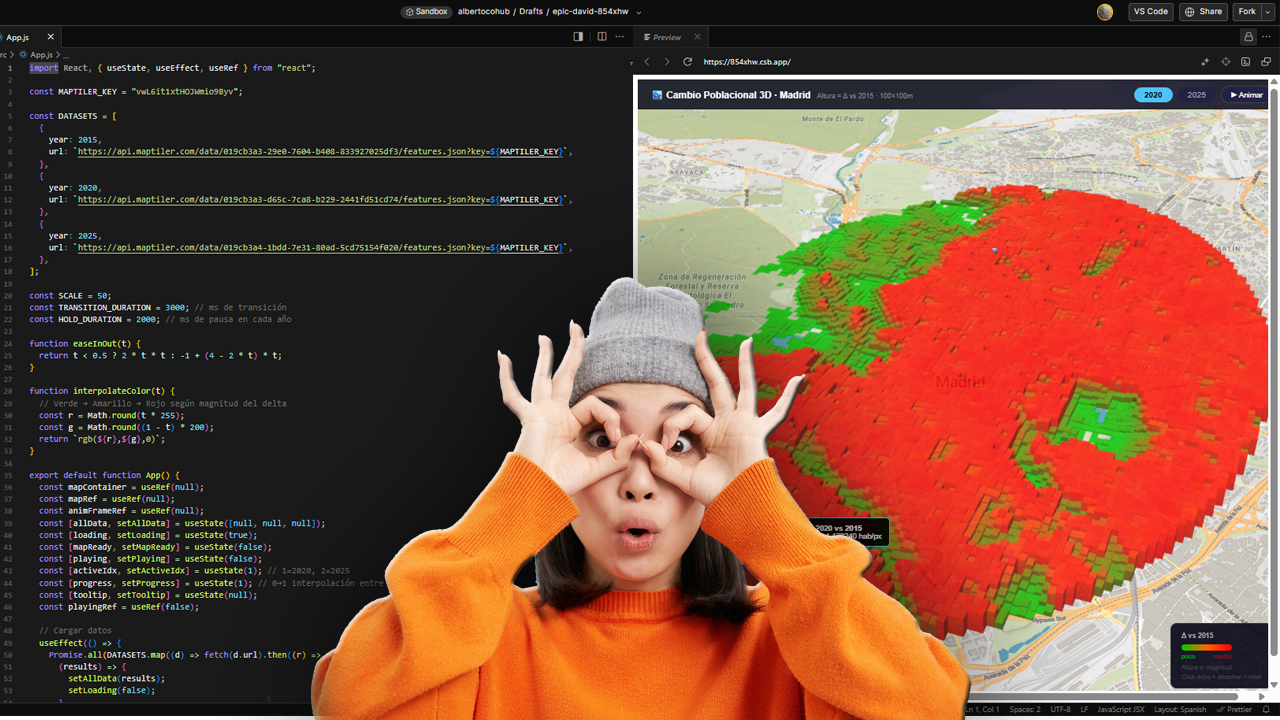
La cartografía siempre ha sido un oficio de precisión, paciencia y criterio espacial. Durante años, el flujo de trabajo de cualquier geógrafo pasaba inevitablemente por entornos de escritorio como ArcGIS Pro o QGIS: cargar capas, ajustar simbología, exportar mapas. Herramientas sólidas, probadas, indispensables. Pero algo está cambiando.
Cada vez más, el análisis espacial ocurre en la nube, en navegadores, en entornos de código. En anteriores post habéis visto algunos test/ideas/aplicaciones que he desarrollado con Javascript Google Earth Engine, que procesa imágenes satelitales a escala planetaria sin mover un solo archivo. Deck.gl y Maplibre renderizan millones de puntos en 3D directamente en el navegador. React convierte un mapa en una aplicación interactiva con pocas líneas de código.
From LIDAR USGS to DSM in a few lines of code. The magic of R
The USGS LiDAR Explorer, hosted via gishub.org, serves as a high-performance web gateway for interacting with the USGS 3D Elevation Program (3DEP) datasets. First thing, go to this GITHUB repository https://github.com/opengeos/maplibre-gl-usgs-lidar, download code for the project (code>download ZIP), get connected with RStudio, save new project and open a script window… It’s all set up!
R analysis for HR corporate talent management
I am a geographer by training, and my professional career has always had a predominantly geospatial focus. Having recently completed a forty-hour course in R, using RStudio and GitHub, I feel that a whole new world of analysis has opened up before me. This work represents the meeting point between my basic geographical instinct and the technical capabilities of statistical programming. It is important to emphasise that I have invented this data and model entirely, so the results have no real meaning and contain inevitable biases. Their sole purpose is to learn and demonstrate the capabilities of this language. I believe that geographical knowledge and code are interdependent, as one without the other would not function successfully. It is precisely this symbiosis that I hope will make a difference in my current job search.
Spatial relationship between “high schools” and “betting shops” in Madrid. A first approach (1)

It is a fact that a betting shop should not be close to a secondary school. Its obvious the impact on population ranging 12-17 could be higher than in other. How near? 100m? 500m? Euclidean distance or following the street network?. In any case, if I choose for instance a range of 500m, for example, 81% of betting shops in Madrid have secondary schools within that distance (258 out of 316). Looking at it from the secondary schools’ point of view, almost 60% of secondary schools have betting shops within 500m (171/291). This is undoubtedly an issue that needs to be addressed.
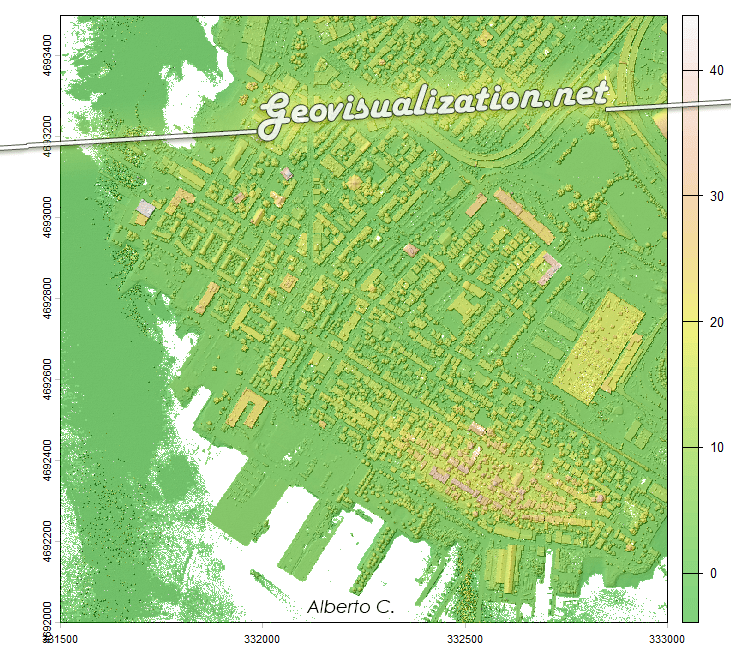
Precision Elevation Data for Forest Giants: LiDAR vs ETH Global Canopy Height in Mata do Buçaco (Portugal)

High‑resolution elevation data underpins almost every spatial analysis we do in GIS—especially in forests where vertical structure defines habitat, biomass, wind exposure, fire behavior, hydrology, and the microclimates that sustain rare species. In rugged or densely vegetated environments, a coarse or biased elevation model propagates error everywhere: orthorectification drifts, hillshades mislead, slope/aspect misclassify, and canopy metrics saturate. The result is decisions made on blurred terrain that hides the very patterns we seek to manage. Precision elevation—derived from airborne LiDAR (Light Detection and Ranging)—solves this by separating the ground from the vegetation and delivering both a bare‑earth Digital Terrain Model (DTM) and a Digital Surface Model (DSM). Subtracting DTM from DSM gives a Canopy Height Model (DHM) that captures the true vertical architecture of the forest at sub‑meter resolution.
¡Al final se nos quema la península este 2025!

Este agosto, España y Portugal han vivido una temporada de incendios excepcionalmente dura. En España, las llamas han calcinado ~382.000 hectáreas (más de seis veces la media reciente) y han dejado víctimas mortales; en Portugal, las superficies quemadas superan las 200.000 hectáreas, muy por encima del promedio 2006–2024 para estas fechas. El humo cruzó fronteras y degradó la calidad del aire a cientos de kilómetros.
Agricultura de Precisión (I). Uso del Satélite para la toma de decisiones en el campo

Quieres conocer cuál es el momento óptimo para plantar? Para fumigar? Para recolectar?. Sabías que dos de cada tres agricultores no cosechan en la fase de madurez adecuada?. Aquí abajo te describo un método completamente automatizado mediante el uso combinado de varios índices de vegetación como NDVI, NDWI, SAVI y EVI que podemos extraer del Satétile SENTINEL-2 en la plataforma COPERNICUS de la UE para conocer exactamente y anticipar las mejores decisiones de intervención sobre tus tierras.
Spider diagrams in GEE and QGIS

Hace unos días, caminando por una calle concreta —no muy lejos de mi casa, la cual recorro con regularidad— me pregunté cuál era realmente la estación de metro más cercana. Tiendo a pensar que siempre es Puerta del Ángel… y en realidad, lo es. Pero aún así, quise comprobarlo quantitativamente, empíricamente. ¿Y si no fuera tan evidente?
En este tutorial se explica cómo crear un efecto visual dinámico en QGIS que simula una «araña» (ragnetto) que conecta automáticamente los 8 puntos más cercanos al cursor del mouse. Esta funcionalidad permite visualizar relaciones espaciales de forma interactiva y resulta especialmente útil para análisis de proximidad.
