
La gestión y monitorización de fenómenos hidrológicos extremos, como inundaciones repentinas o fallos estructurales en presas, representan un desafío crítico para los especialistas en geomática, hidrología y planificación territorial. En este contexto, la tecnología radar de apertura sintética (SAR) a bordo del satélite Sentinel-1 de la Agencia Espacial Europea (ESA) ofrece una capacidad sin precedentes para capturar información precisa y fiable sobre la dinámica superficial, independientemente de las condiciones atmosféricas y lumínicas.
Category Archives: Visualization Engine
Urban delineation methods beyond administrative boundaries
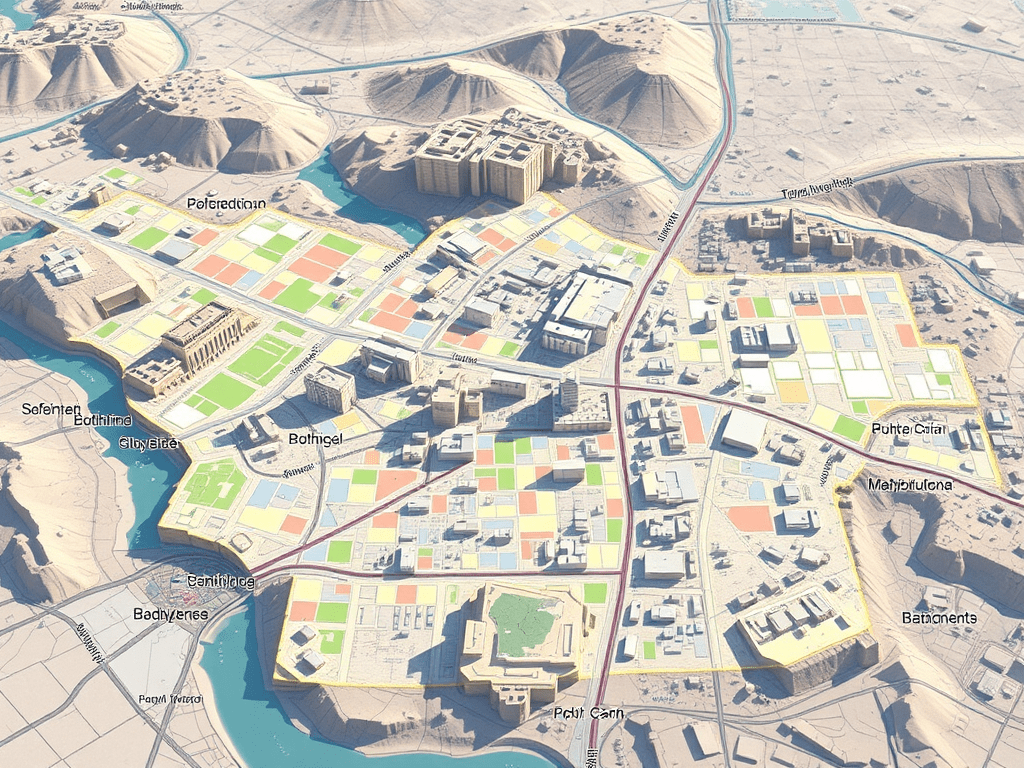
As a geographer working with Geographic Information Systems (GIS), I am particularly interested in exploring urban delineation methods that move beyond the constraints of administrative boundaries. Instead of relying on official municipal limits—which can often be outdated or misaligned with functional realities on the ground—I focus on delineating urban areas based on physical indicators such as built-up surface, population density, and spatial continuity. This approach allows for a more accurate and dynamic understanding of urban space.
Sequía en Cataluña – Timelapse 2017-2024

Las restricciones más duras de emergencia por sequía se extenderán a más de seis millones de personas de los 202 municipios de Barcelona y algunas poblaciones de Girona. Así lo ha anunciado este jueves la Generalitat, que suma estas localidades a las 37 (125.000 habitantes) de las comarcas de Alt Empordà, Baix Camp y Baix Llobregat, que ya estaban en la fase más severa desde agosto. Esto significa que casi el 80% de la población catalana vive en una zona en emergencia por la crisis hídrica.
The Remarkable Visibility of Almeria’s Greenhouses from Space

In the sphere of Earth observation and remote sensing, the Almeria greenhouses stand out as an astonishing spectacle visible even from the edge of space, defined by the Kármán line at approximately 100 kilometers in altitude. This unique visibility is not only a testament to the vast scale of human agricultural activity but also a captivating example of the power of satellite-based remote sensing technologies.
Digital Twin. Real-Time Public Transportation Visualization on LiveMaps360.com
The primary feature of LiveMaps360.com is its ability to display public transportation data in real-time. By integrating data from Tokyo’s extensive public transportation network, including buses, trains, and subways, the website enables users to track the movement of vehicles and access critical information such as arrival times, routes, and service disruptions.
Inland Water levels… Globally. Copernicus did it again!
The Water Observatory is an Earth-observation-based solution that provides reliable and timely information about surface water levels of waterbodies across the globe. All observations are provided and can be explored interactively via the Water Observatory Dashboard or via RESTful API. The Water Observatory provides a valuable service to local authorities, governmental agencies, natural parks and reserves, agricultural ministries and agencies, stakeholders in food and energy production, and citizens alike.
Google Earth Engine and Dynamic World

Let me please introduce you this “new” LULC source I have come across with recently. The potential of this 10m “clutter” source is being able to acquire data from a few days ago instead of using outdated “very old” 2020 vintage datasets. I know if these days something 2020 is very old then myself, born in 1972 then i’m older than the riverside, older than peeing in a wall, even older than Methuselah. Yes, that’s the way it is nowadays.
Google Earth Engine is a geospatial processing service where you can perform geospatial processing at scale, powered by Google Cloud Platform. The purpose of Earth Engine is to:
Provide an interactive platform for geospatial algorithm development at scale
Enable high-impact, data-driven science
Make substantive progress on global challenges that involve large geospatial datasets
Ship Monitoring from space: SUEZ
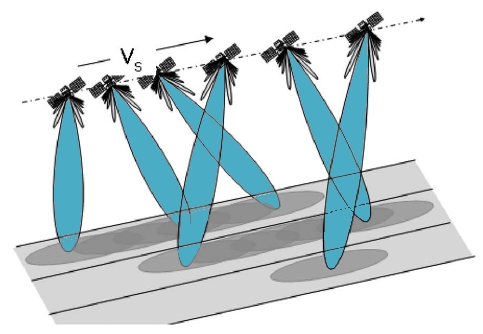
Below you can see the example timelapse of Suez Canal ship traffic, made with a Sentinel-1 custom composite visualization. You can observe the moving ships as time passes.
Sentinel-1 is a pair of European radar imaging (SAR) satellites launched in 2014 and 2016. Its 6 days revisit cycle and ability to observe through clouds makes it perfect for sea and land monitoring, emergency response due to environmental disasters, and economic applications. This dataset represents the global Sentinel-1 GRD archive, from beginning to the present, converted to cloud-optimized GeoTIFF format.
Sentinel-hub: Highlighting value differences in deserts! (not only!)
This Sentinel-2 aesthetic script can be used to produce beautiful, neon looking results over urban and dry areas. The script is especially useful to highlight value differences in deserts. It’s essentially an RGB composite, with a B12 and B04 difference (which does a good job at displaying certain desert features, like dunes) in the red,Continue reading “Sentinel-hub: Highlighting value differences in deserts! (not only!)”
Visualising Wind from a GRIB Mesh Layer in QGIS and Create an Animated GIF

For a brief introduction into this new GRIB Mesh format (new to me) I followed step by step this tutorial bellow I had found in Hans Van der Kwast YouTube channel, it happened to be very good source and I finally made it (see below). The idea was analysing the winds during a Storm in the Netherlands (this storm was actually the 14th of March 2022 but I analyzed the 15th, no impact on the tutorial whatsoever but please note this point).
