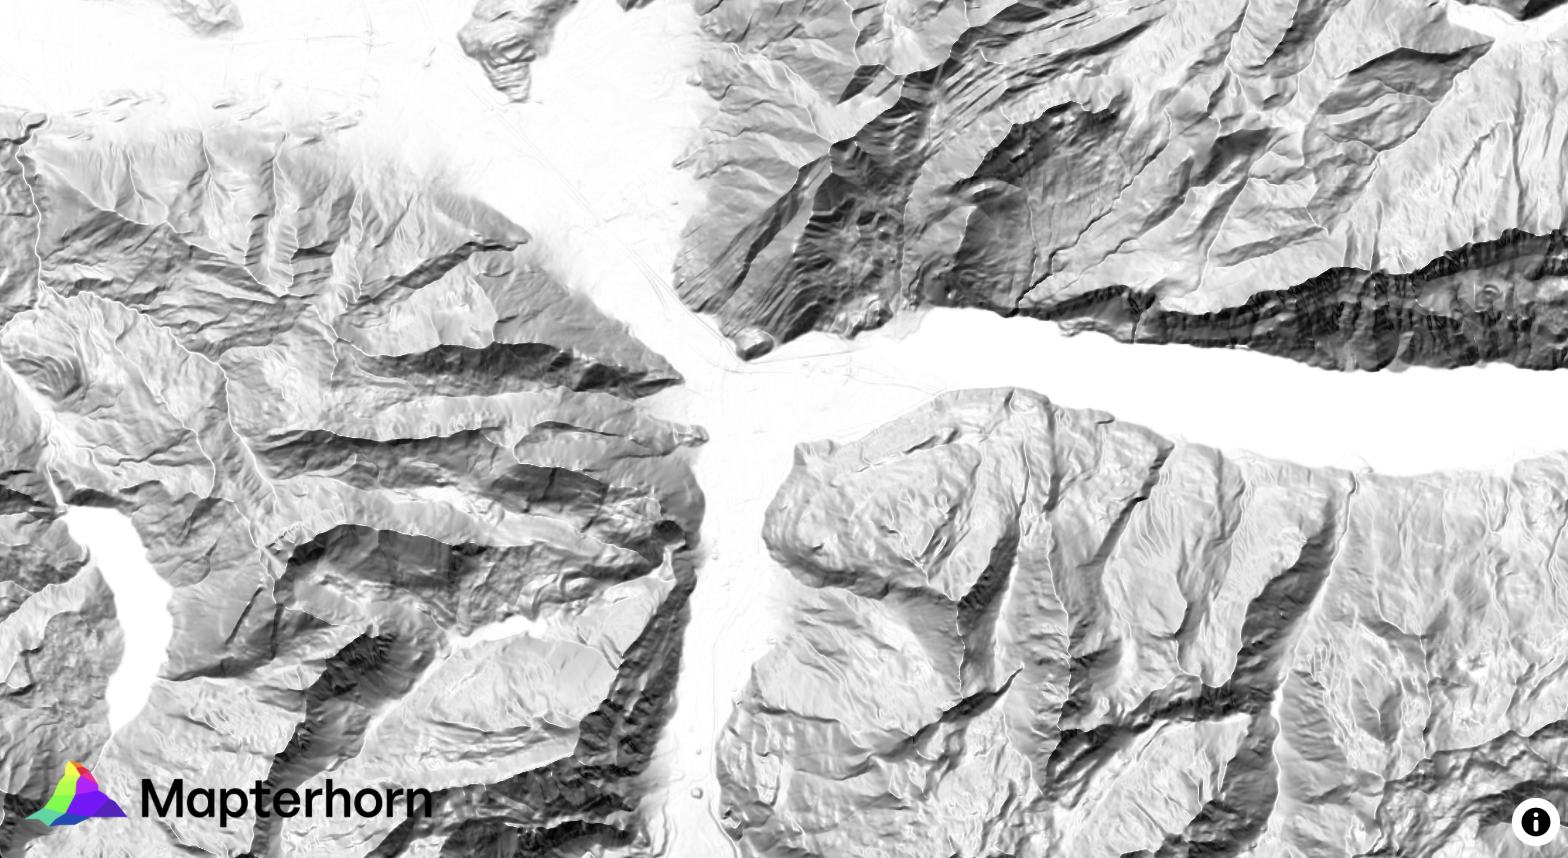
Mapping Something Unthinkable: Flood Risk in Madrid using Open Data

Dont get wrong if you see the IA background showing our handsome major almost showing his beautiful smile in Cibeles/Correos it’s only to get your attentions (only if you need it thou!). Flooding in urban environments is not a speculative hazard but something we can quantify. In the case of Madrid, the intersection of pretty mountainous terrain (it might surprise you there are 2000m difference between the highest spot in Madrid province, Pico Peñalara -2428m- and the Alberche river environment in some areas -430m-) and urban expansion presents a scenario of significant risk, particularly when analyzed through the lens of shared high-resolution geospatial data. This study integrates the buildings from BTN (Base Topográfica Nacional) provided by the Spanish “IGN”, the CNIG with the official flood hazard maps for a 100-year return period (T=100), published by the Ministry for the Ecological Transition and the Demographic Challenge (MITECO). The T=100 scenario is the most representative for evaluating long-term flood exposure, as it reflects events with a 1% annual probability—rare but not improbable, and certainly not negligible.

Análisis de la inundación en Sant Llorenç des Cadassar (Baleares, España) en Octubre 2018

Esta simulación con datos reales permite constatar empíricamente la pésima ubicación del pueblo en medio del cauce de un torrente al mismo tiempo que muestra lo osado de no gastar el dinero suficiente en infrastructuras que salven la vida de los habitantes de un entorno potencialmente peligroso en situaciones de borrascas ocluídas (gotas frías) o ciclogénesis expansivas, tan comunes en esta epoca del año por esta zona.

El láser desvela toda la grandeza de la civilización maya (Fuente: El País)

Esta mañana encontré este interesante reportaje sobre el LIDAR (Laser Imaging Detection and Ranging, detección y localización de imágenes por láser) la tecnología con la que trabajo desde hace años y que a algunos les parece recién inventada, jeje.

LIDAR Madrid LAZ 20cm

Ya van varias veces en el último mes que alguien no especialista en temas geográficos-cartográficos me habla de ‘ese sistema’ de láser para saber ‘la altura del terreno’ y es que la verdad es que LIDAR parece magia. Es bastante increible que pase un avión con una tecnología invisible a ojos humanos y que seContinue reading “LIDAR Madrid LAZ 20cm”

Descargas del CNIG. Open Source bien hecho!

Hola amigos del GIS, Por motivos de trabajo que no vienen al caso, he tenido que bucear de manera sistemática la web de descargas del CNIG. http://centrodedescargas.cnig.es/CentroDescargas/inicio.do Una maravilla. Por motivos que tampoco viene al caso, he de hacer esto mismo de vez en cuando en todos los Institutos cartográficos del mundo y el delContinue reading “Descargas del CNIG. Open Source bien hecho!”

Risk exposure. Geoprocessing using Open Source Data!! Next steps!!

Now that we have completed a first example, let’s continue with a real-world one. Its important working on a Data Model to define what we understand as a Risk and how important this is. Meaning. High voltage power lines are an actual risk but the closer we are, i guess the bigger the risk is, meaning i.e 3 if we are within 50m and 1 if we are 150m away… It’s only a guess.