
Enclavado en un entorno rural de gran belleza natural (Latitud: 40° 18′ 3” Norte Longitud: 4° 26′ 37” Oeste) Cadalso de los Vidrios se enfrenta a una realidad económica marcada por la fragilidad y la dependencia. Con un tejido industrial prácticamente inexistente, el pueblo se sustenta principalmente en dos pilares: el ínfimo sector agrario y el sector de la construcción y los servicios. Esta dependencia económica limita las oportunidades de desarrollo y aumenta la vulnerabilidad frente a situaciones adversas, entre ellas, la explotación descontrolada de los recursos mineros y forestales.
Category Archives: open data
Sequía en Cataluña – Timelapse 2017-2024

Las restricciones más duras de emergencia por sequía se extenderán a más de seis millones de personas de los 202 municipios de Barcelona y algunas poblaciones de Girona. Así lo ha anunciado este jueves la Generalitat, que suma estas localidades a las 37 (125.000 habitantes) de las comarcas de Alt Empordà, Baix Camp y Baix Llobregat, que ya estaban en la fase más severa desde agosto. Esto significa que casi el 80% de la población catalana vive en una zona en emergencia por la crisis hídrica.
The Remarkable Visibility of Almeria’s Greenhouses from Space

In the sphere of Earth observation and remote sensing, the Almeria greenhouses stand out as an astonishing spectacle visible even from the edge of space, defined by the Kármán line at approximately 100 kilometers in altitude. This unique visibility is not only a testament to the vast scale of human agricultural activity but also a captivating example of the power of satellite-based remote sensing technologies.
No words (or almost)

Visualization 12-11-4 Sentinel 2 in relation to events in and around the Gaza Strip in early October 2023. It is difficult to remain aseptic even when talking about something technical. I will only say that I am ashamed of the world today. I am ashamed of the rulers and the ignorance of those who followContinue reading “No words (or almost)”
Digital Twin. Real-Time Public Transportation Visualization on LiveMaps360.com
The primary feature of LiveMaps360.com is its ability to display public transportation data in real-time. By integrating data from Tokyo’s extensive public transportation network, including buses, trains, and subways, the website enables users to track the movement of vehicles and access critical information such as arrival times, routes, and service disruptions.
I FORO NACIONAL: CIENCIAS DE DATOS ESPACIALES COMO HERRAMIENTA EFICAZ EN LA GESTION PUBLICA. Lima (Perú)

Esta pasada semana he tenido el honor de viajar a Lima (Perú) para participar en el el Primer Foro Nacional de Ciencias de Datos Espaciales como herramienta eficaz para la gestión pública estos pasados 18-19 Julio 2023 en el Centro de Convenciones de Lima, Perú. Mi ponencia era sobre el DIGITAL TWIN en la ciudad de CUZCO así como el BRIGHT EARTH CITY TEXTURING, una solución de texturización procedural con semántica 3D de bajo mantenimento de mi empresa Luxcarta, un gran adelanto tecnológico de nuestro departamento de I+D.
The beauty (and precision) of LIDAR:

Lidar, which stands for Light Detection and Ranging, is a technology that uses laser beams to measure distances and create detailed maps of the surrounding environment. It works by emitting laser pulses and then measuring the time it takes for the pulses to bounce back after hitting objects in their path. By analyzing the returning signals, lidar can accurately calculate the distance to various points and generate a three-dimensional map.
Learning to use GOES constellation

GOES satellites continually view the continental United States, Pacific and Atlantic Oceans, Central and South America, and Southern Canada. To fully cover Alaska, Hawaii, the entire continental United States and the Pacific and Atlantic Oceans (for tropical storms), NOAA operates two GOES satellites simultaneously
Measuring snow coverage using EOB – Earth Observation – Sentinel HUB
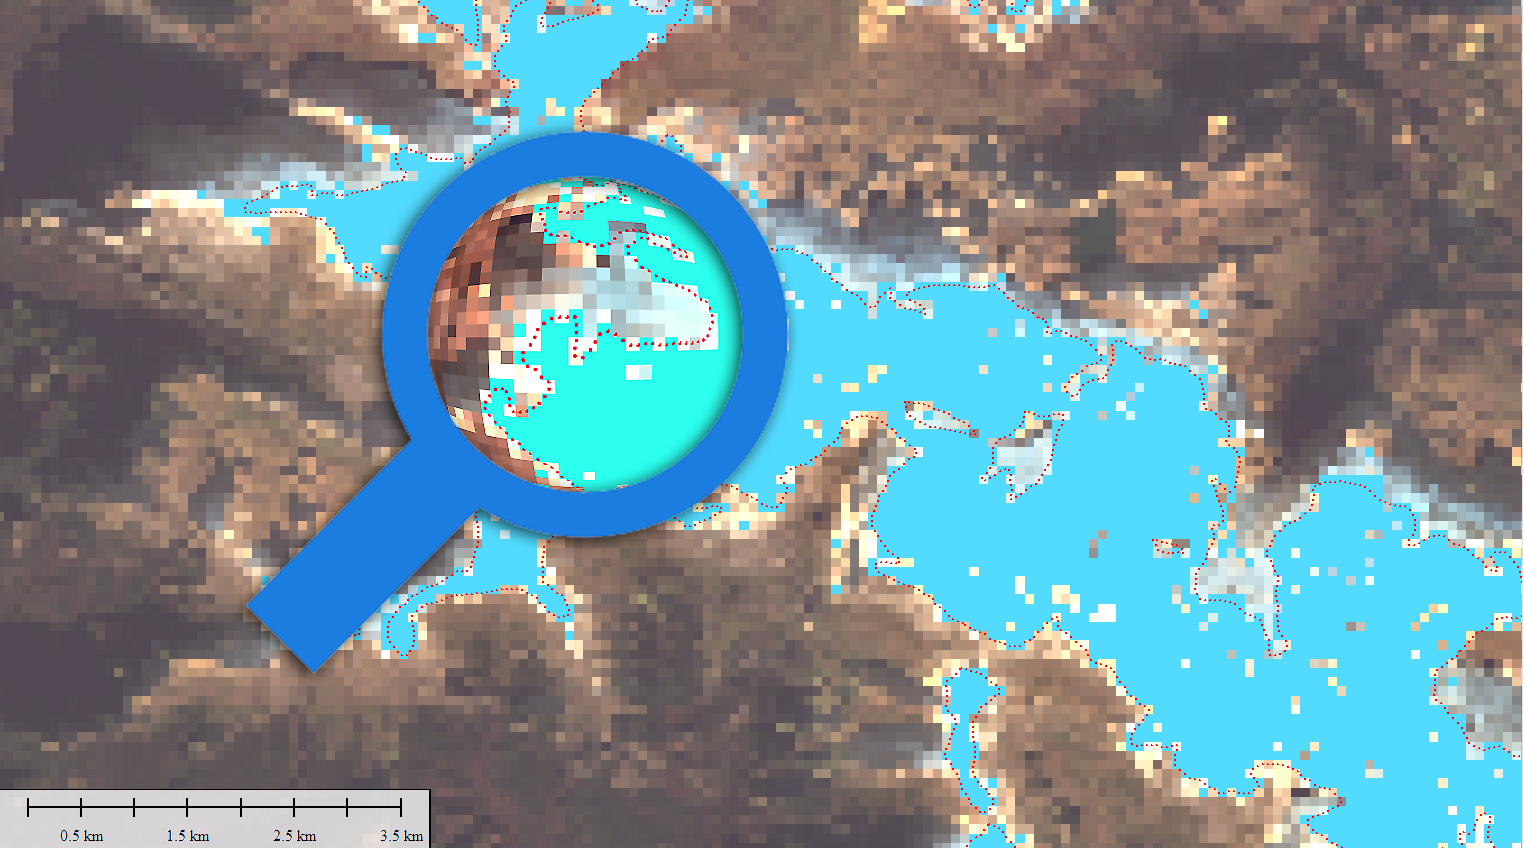
Playing with Sentinel 2 images I realized that the amount of snow this year has been very low compared to last winter. Here are a couple of images from January 2022 and 2023 of the Canfranc – Paticosa – Jaca area. One of the most interesting things about this EO browser is that in addition to a standard 2D visualisation, we can visualise in 3D. Here is an video example. Another interesting thing is to be able to quantify the snowfall. There is a snow classifier based on NSDI (Normalized Difference Snow Index, The Normalized Difference Snow Index (NDSI) snow cover is an index that is related to the presence of snow in a pixel and is a more accurate description of snow detection as compared to Fractional Snow Cover (FSC).
Consultoría e ideología: Manual de estupidez

Yo soy un humilde Geógrafo, además soy alguien curioso al que no le importa meterme en mil fregados por las razones más variadas, que ha trabajado y trabaja como tal pero también como diseñador, como fotógrafo o como comercial. He trabajado con obreros, con arquitectos, porteros de fincas, con dibujantes, con consultores de todos losContinue reading “Consultoría e ideología: Manual de estupidez”
