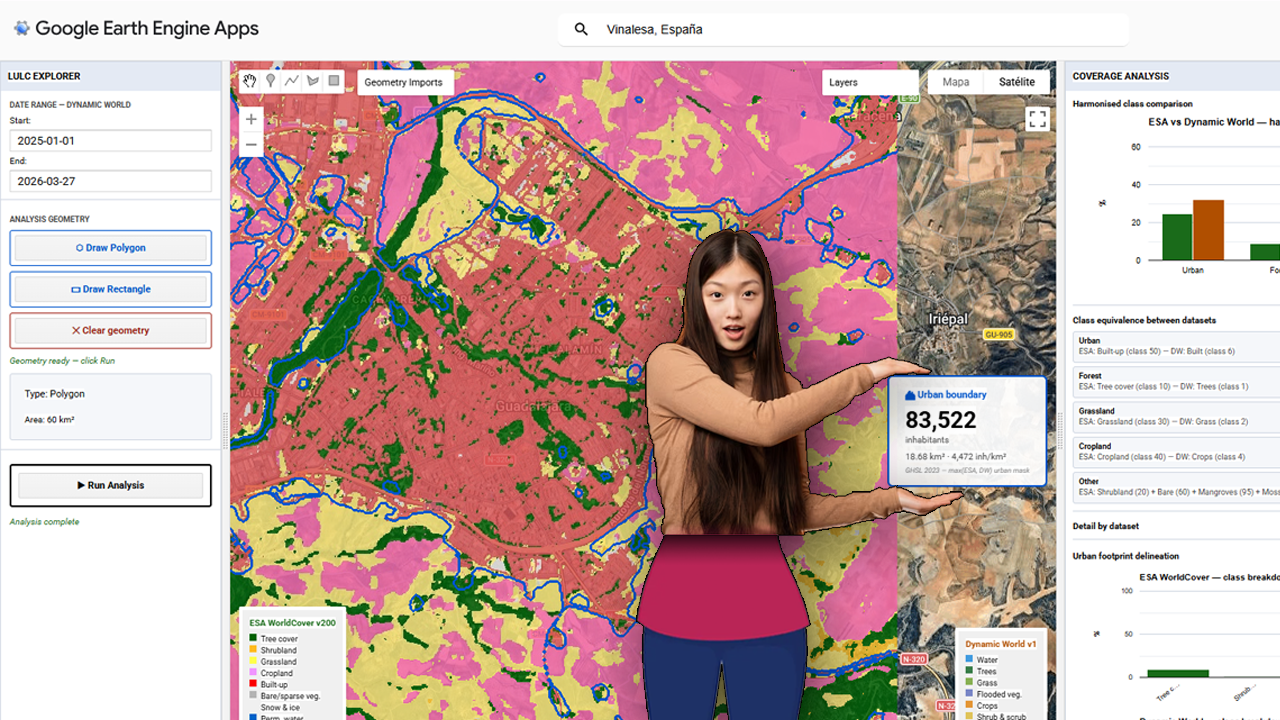
The foundational step of this methodology involves the deployment of a centralized processing interface within the Google Earth Engine (GEE) environment. The provided visualization captures the core interface of the custom GEE application, which serves as the hub for the multi-sensor LULC validation pipeline. Within this dashboard, users can define a specific Area of Interest (AOI)—highlighted here over the Iberian Peninsula and North Africa—and configure key parameters, including temporal ranges for the acquisition of sentinel-derived products. Crucially, the interface is designed to load and compare two primary datasets simultaneously: Dynamic World (near real-time, probability-based LULC) and ESA WorldCover (10m resolution structured LULC). The contrasting classification schemes are represented by the legends on the left and right sides of the map view, which illustrate the varying definitions of ‘Built-up’ and urban areas between the two products. Establishing this visual and statistical comparison at the application level is the prerequisite for calculating the spatial disagreement threshold, or delta, that guides the subsequent merging and population estimation phases.
Category Archives: geomarketing
Aventuras y desventuras de un geógrafo en “desarrollo”
La cartografía siempre ha sido un oficio de precisión, paciencia y criterio espacial. Durante años, el flujo de trabajo de cualquier geógrafo pasaba inevitablemente por entornos de escritorio como ArcGIS Pro o QGIS: cargar capas, ajustar simbología, exportar mapas. Herramientas sólidas, probadas, indispensables. Pero algo está cambiando.
Cada vez más, el análisis espacial ocurre en la nube, en navegadores, en entornos de código. En anteriores post habéis visto algunos test/ideas/aplicaciones que he desarrollado con Javascript Google Earth Engine, que procesa imágenes satelitales a escala planetaria sin mover un solo archivo. Deck.gl y Maplibre renderizan millones de puntos en 3D directamente en el navegador. React convierte un mapa en una aplicación interactiva con pocas líneas de código.
ESTIMATED GHSL vs INE 2025
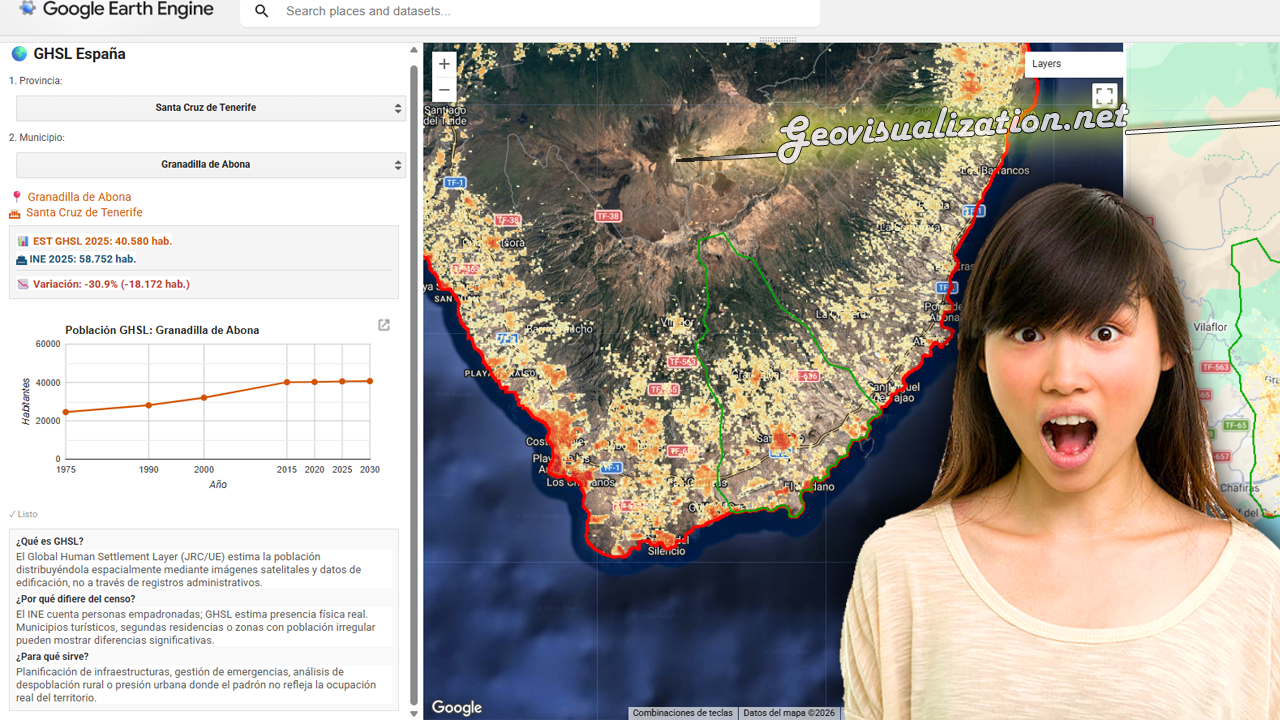
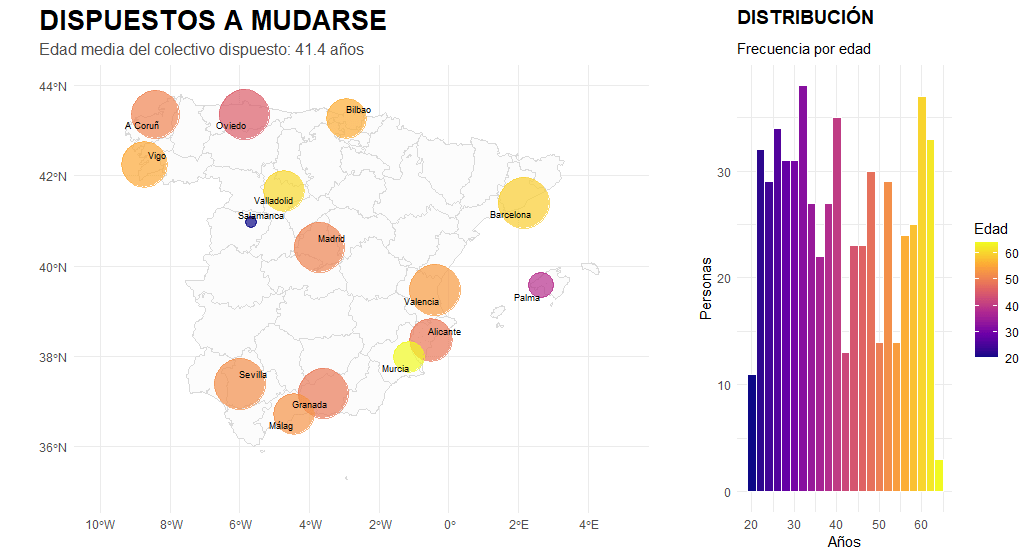
He desarrollado este COMPARADOR DE POBLACIÓN GHSL vs PADRÓN INE 2025 en JavaScript/Google Earth Engine que cruza estimaciones satelitales de población con los datos oficiales del censo español municipio a municipio.
La herramienta permite seleccionar cualquier provincia y municipio de España, visualizar la distribución espacial de población estimada por el GHSL con el último dato oficial del INE 2025, detectando municipios con alta presión turística, despoblación real o población no registrada.
Una aplicación directa para planificación de infraestructuras, gestión de emergencias o análisis de cohesión territorial donde el padrón no refleja la ocupación real del territorio.
¡Con R de running!
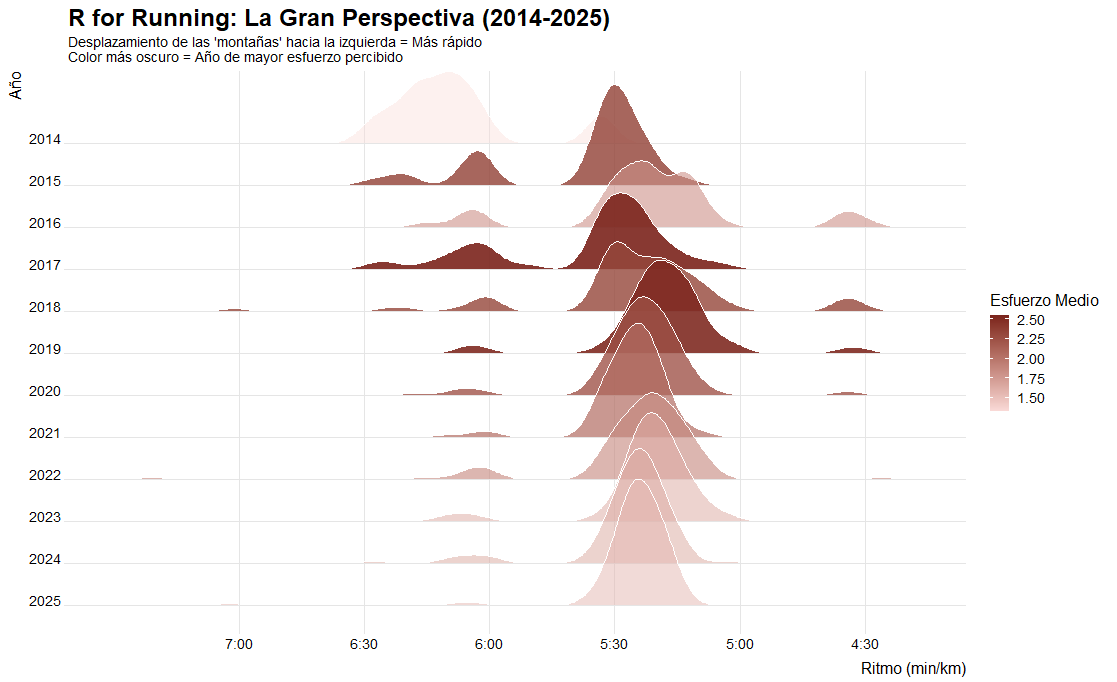
Un registro constante: más de 11 años (desde Agosto 2014 hasta hoy) con más de 1,150 sesiones documentadas. Un proyecto vital; no son solo números, es la cronología de mi disciplina. Puedo decir de nuevo que R me ha roto mis esquemas de geógrafo de ArcGIS, de Global Mapper y QGIS, ahora no todo pasa por el filtro de tener coordenadas, por ejemplo estos insights no tienen coordenadas pero son analizables y se pueden tomar conclusiones que te permiten tomar decisiones rápidas… Echemos un vistazo a mis carreras los últimos años.
R analysis for HR corporate talent management
I am a geographer by training, and my professional career has always had a predominantly geospatial focus. Having recently completed a forty-hour course in R, using RStudio and GitHub, I feel that a whole new world of analysis has opened up before me. This work represents the meeting point between my basic geographical instinct and the technical capabilities of statistical programming. It is important to emphasise that I have invented this data and model entirely, so the results have no real meaning and contain inevitable biases. Their sole purpose is to learn and demonstrate the capabilities of this language. I believe that geographical knowledge and code are interdependent, as one without the other would not function successfully. It is precisely this symbiosis that I hope will make a difference in my current job search.
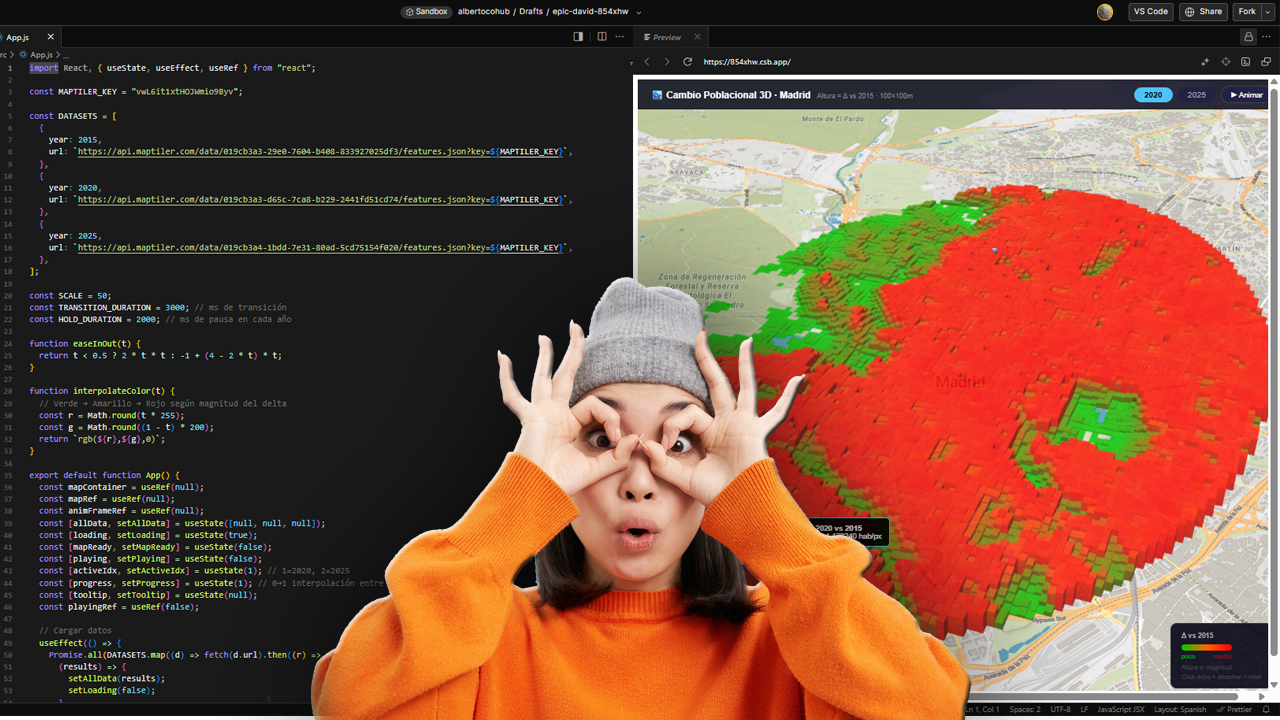
URBAN ATLAS 2018 + WORLDPOP 100m/GHSL 100m estimates over Madrid
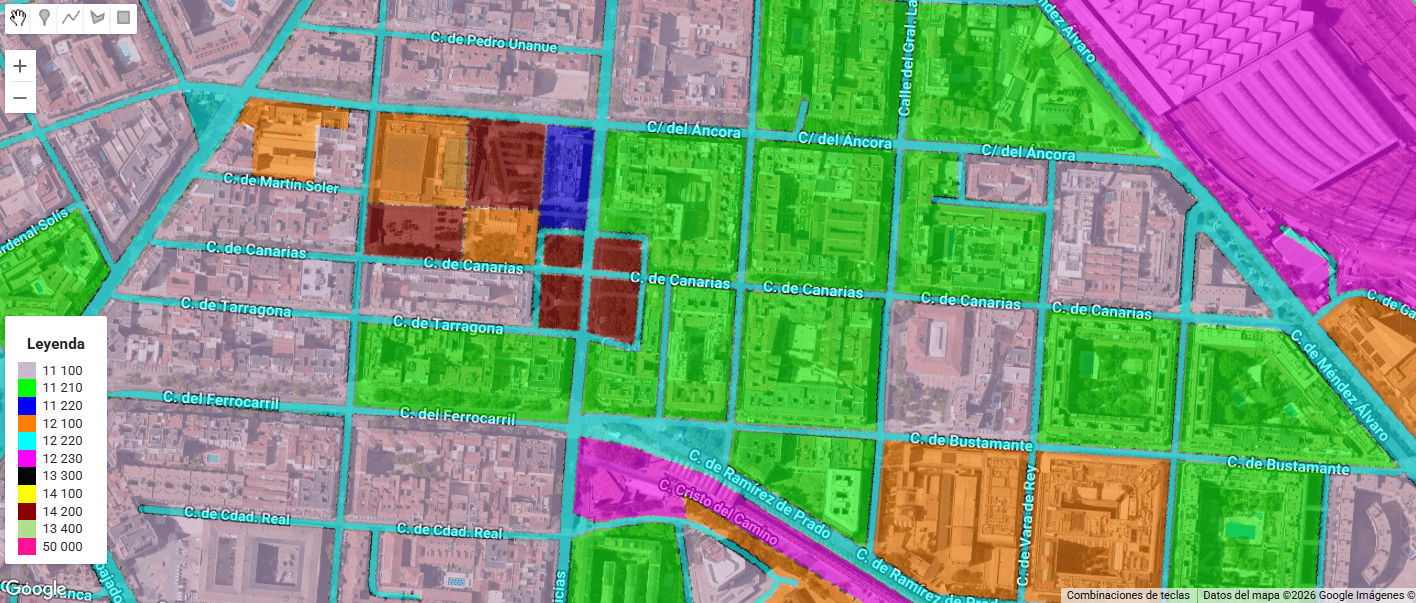
Urban Atlas (UA) representa el estándar de oro dentro del Copernicus Land Monitoring Service (CLMS) para el análisis de la morfología urbana en Europa. A diferencia de Corine Land Cover, UA ofrece una resolución temática y espacial drásticamente superior (Unidad Mínima de Mapeo de 0.25 ha para clases urbanas), permitiendo discriminar entre tejidos urbanos continuos y discontinuos con una precisión de densidad del 10% al 80%.
Testing GEMINI for 3D environments. From SketchUp to an unlikely future!
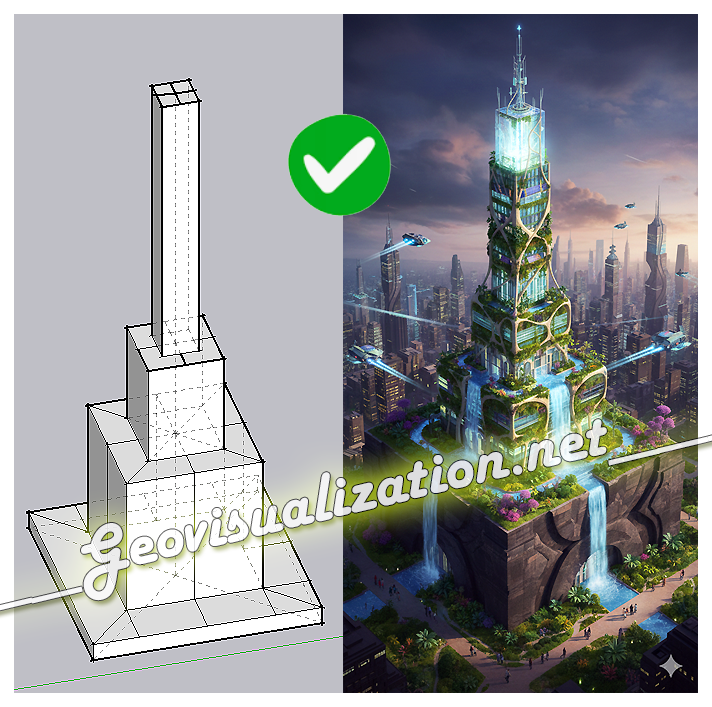
The exercise shows how a simple SketchUp 3D volume, defined solely by its basic geometry, can be transformed into a complex architectural proposal. Starting from the initial schematic model, the system interprets proportions, levels, and shapes, and converts them into a fully developed building, complete with textures, vegetation, lighting, and an urban context
Spatial relationship between “high schools” and “betting shops” in Madrid. A first approach (1)

It is a fact that a betting shop should not be close to a secondary school. Its obvious the impact on population ranging 12-17 could be higher than in other. How near? 100m? 500m? Euclidean distance or following the street network?. In any case, if I choose for instance a range of 500m, for example, 81% of betting shops in Madrid have secondary schools within that distance (258 out of 316). Looking at it from the secondary schools’ point of view, almost 60% of secondary schools have betting shops within 500m (171/291). This is undoubtedly an issue that needs to be addressed.
REBATE A TU CUÑADO SOBRE “LLUVIA”

¿Cuántas veces has oído a tu cuñado (o cuñada) decir en una comida familiar frases tipo:
Antes llovía más, se está desertificando todo!”
“¡Yo ya lo noto, desde que era niño no ha vuelto a llover igual!”
En lugar de entrar en debates circulares, te propongo usar Google Earth Engine (GEE), una plataforma gratuita (si demuestras que no vas a usarlo comercialmente, claro) de computación geoespacial en la nube, y una fuente de datos de primer nivel: CHIRPS (Climate Hazards Group InfraRed Precipitation with Station data).
Agricultura de Precisión (I). Uso del Satélite para la toma de decisiones en el campo

Quieres conocer cuál es el momento óptimo para plantar? Para fumigar? Para recolectar?. Sabías que dos de cada tres agricultores no cosechan en la fase de madurez adecuada?. Aquí abajo te describo un método completamente automatizado mediante el uso combinado de varios índices de vegetación como NDVI, NDWI, SAVI y EVI que podemos extraer del Satétile SENTINEL-2 en la plataforma COPERNICUS de la UE para conocer exactamente y anticipar las mejores decisiones de intervención sobre tus tierras.
