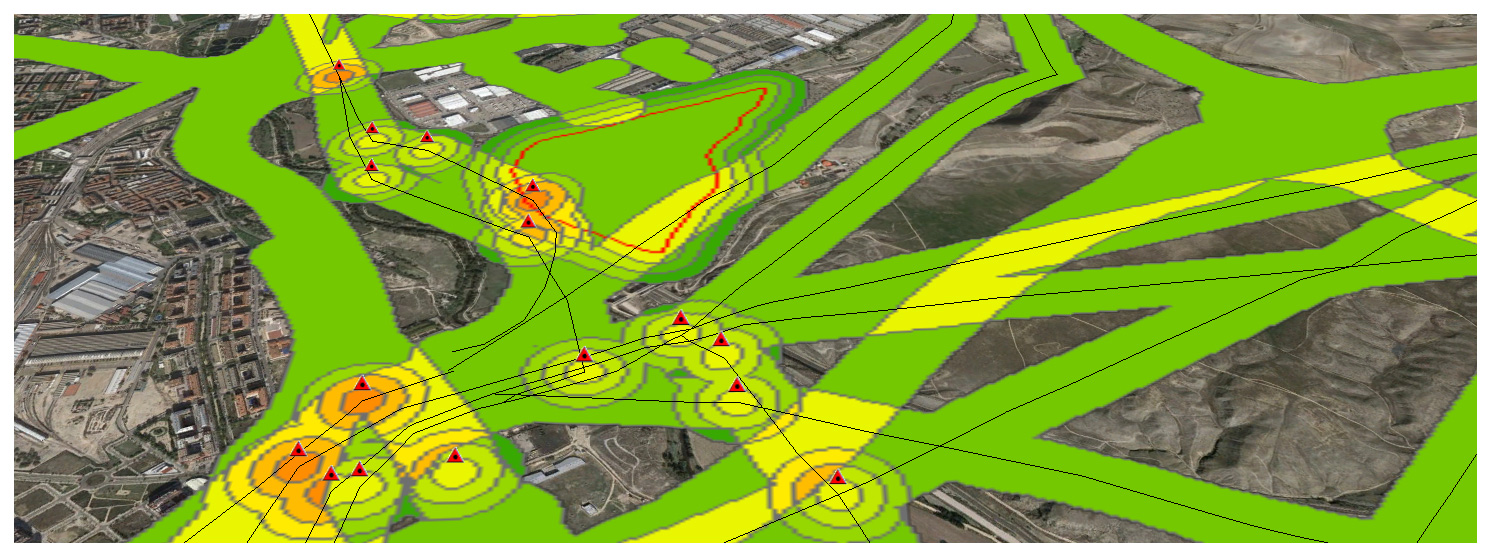
Now that we have completed a first example, let’s continue with a real-world one. Its important working on a Data Model to define what we understand as a Risk and how important this is. Meaning. High voltage power lines are an actual risk but the closer we are, i guess the bigger the risk is, meaning i.e 3 if we are within 50m and 1 if we are 150m away… It’s only a guess.
Tag Archives: sig
Risk exposure. First steps

Knowing how to geoprocess features is key if what we want is assesing risk exposure. What’s a risk? Which are the risks? Where are the risks? How important a risk is?
Jugando con CartoDB

Hace ya mucho tiempo que he oído hablar de CartoDB y que vengo practicando en su página web a visualizar bases de datos sencillas. Crea una cuenta Incorpora tus datos o tómalos de la galería Selecciona en modo datos la columna que quieres simbolizar/visualizar Conviértela en NUMBER si estuviera en STRING Selecciona en modo mapaContinue reading “Jugando con CartoDB”
Change detection – Detección de cambios en polígonos
THE PROCEDURE: Centroids of buildings; Spatial join showing presence-absence, considering a 10m accuracy threshold, meaning if the centroid has not moved more than 10m, its the same building. If the centroid in 2012 is not in 2014, its considered as demolished. If a new centroid appears its considered new building.
La geográfica cabecera de ‘Up in the air’ con George Clooney
Para alguien que maneja mapas a diario es una sorpresa interesante cruzarse con esta cabecera de la película de Jason Reirman protagonizada por George Clooney ‘Up in the air’. Nubes, campos de cultivo, ciudades en 2D, 3D. Qué bien he elegido mi profesión:-) Para alguien que viaja mucho, salvando las distancias, este vídeo, también delContinue reading “La geográfica cabecera de ‘Up in the air’ con George Clooney”
DTM validation using Google Earth (and RMSE extraction)
Hi guys, Surfing the internet is great when you need to figure out something. I needed to validate some DTM from unknown sources against an also unknown source (but at least a kind of reliable one, Google Earth). All we need is Google Earth TCX converter ARcGIS Excel This is the procedure i have followed:Continue reading “DTM validation using Google Earth (and RMSE extraction)”
Pearson correlation and GIS
Do these two variables have a correlation?. To answer this important question first of all we have to know that only if it’s a linear relationship and there are no outliers we can take advantage of Mr Pearson’s correlation statiscal tool. If i love chocolate, does this mean i have tendency of being chuby? orContinue reading “Pearson correlation and GIS”
‘Reality Checks’, also called ‘Ground Truth Tests’
Comparing all kind of Geodata (i.e 3D Buildings, DTM, DHM, DSM, Land Use, vectors,…) to background sources as Google Earth/ Bing, available sources from the country we are working on or WMS available sources, etc. Figuring out if the data requested and we want to deliver is consistent enough compared to the so called “Truth”. SomeContinue reading “‘Reality Checks’, also called ‘Ground Truth Tests’”
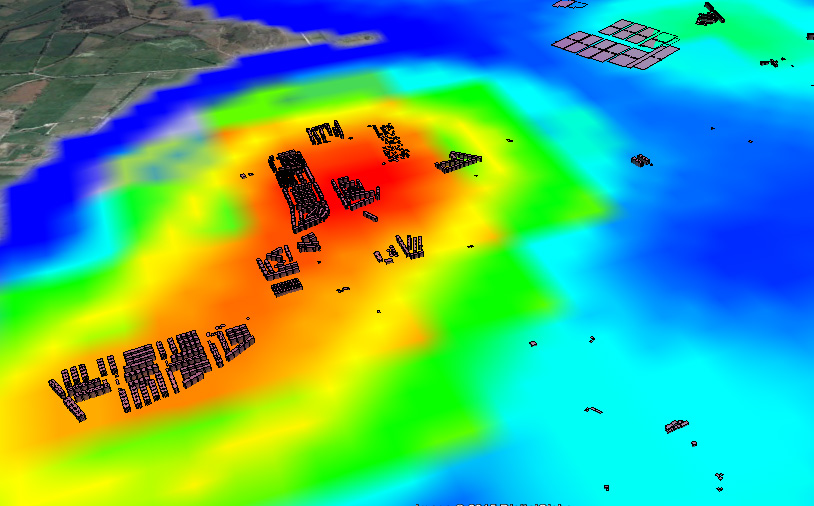
RSME comparing LIDAR data with a third party’s 3D dataset
I would like to share with you an easy analysis i have been working in the last days. I had a vector dataset of buildings and i knew how high they were (there was a field called ‘AGL’ or Above Ground Level) and a LIDAR 2m resolution dataset over the city of London. My aimContinue reading “RSME comparing LIDAR data with a third party’s 3D dataset”
PISA report SPAIN 2012 by Comunidades Autónomas Trends North-South and West-East
I wanted to take advantage of the latest ‘advanced course on Statistical Analysis’ followed in the spanish IGN and show you how North-South and West-East trends impact on this report. As you can see, the higher the values, the most likely to be in the North and the East of the country. This doesn’t meanContinue reading “PISA report SPAIN 2012 by Comunidades Autónomas Trends North-South and West-East”
