I am a geographer by training, and my professional career has always had a predominantly geospatial focus. Having recently completed a forty-hour course in R, using RStudio and GitHub, I feel that a whole new world of analysis has opened up before me. This work represents the meeting point between my basic geographical instinct and the technical capabilities of statistical programming. It is important to emphasise that I have invented this data and model entirely, so the results have no real meaning and contain inevitable biases. Their sole purpose is to learn and demonstrate the capabilities of this language. I believe that geographical knowledge and code are interdependent, as one without the other would not function successfully. It is precisely this symbiosis that I hope will make a difference in my current job search.
Tag Archives: sig
URBAN ATLAS 2018 + WORLDPOP 100m/GHSL 100m estimates over Madrid
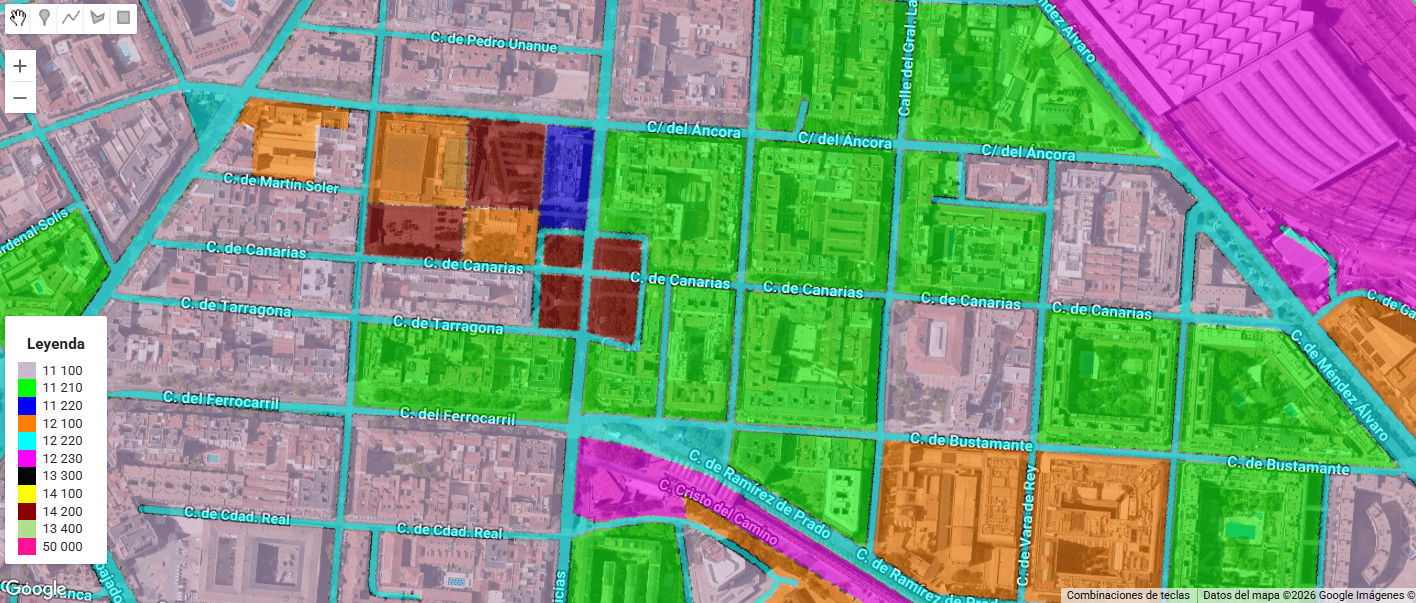
Urban Atlas (UA) representa el estándar de oro dentro del Copernicus Land Monitoring Service (CLMS) para el análisis de la morfología urbana en Europa. A diferencia de Corine Land Cover, UA ofrece una resolución temática y espacial drásticamente superior (Unidad Mínima de Mapeo de 0.25 ha para clases urbanas), permitiendo discriminar entre tejidos urbanos continuos y discontinuos con una precisión de densidad del 10% al 80%.
Analyzing Spatial Correlation between Purchase Power Index and Gambling Stores (2)

This GIS study applies Geographically Weighted Regression (GWR) to investigate the spatial relationship between Purchasing Power Index (PPI) and the distribution of gambling-related retail establishments within the city of Madrid. My aim is to account for spatially varying relationships driven by local urban contexts, under the assumption that the relationship between socioeconomic conditions and the presence of gambling venues varies across urban space. My hypothesis is that the socioeconomic conditions of the urban fabric can be a breeding ground for the location of betting shops, or in other words, I am attempting to Detect Urban Vulnerability to Gambling Harm.
Testing GEMINI for 3D environments. From SketchUp to an unlikely future!
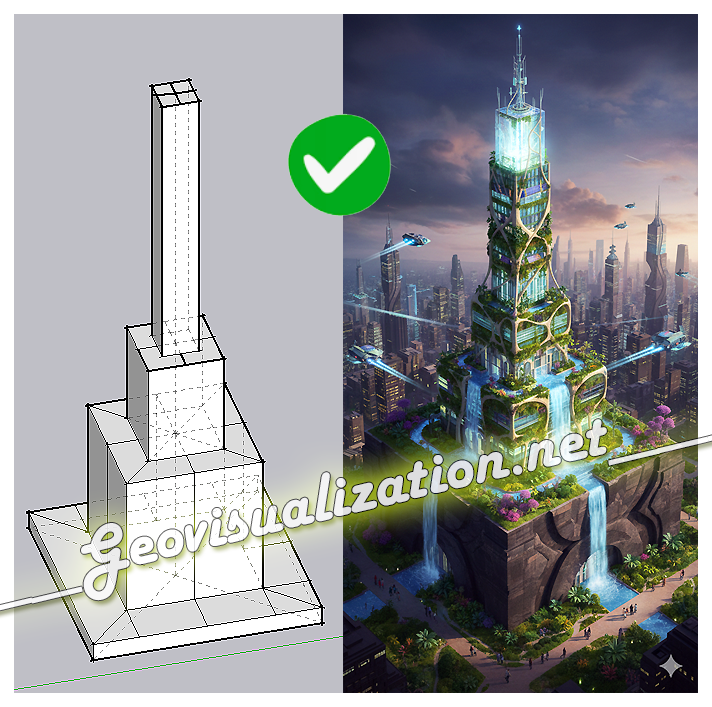
The exercise shows how a simple SketchUp 3D volume, defined solely by its basic geometry, can be transformed into a complex architectural proposal. Starting from the initial schematic model, the system interprets proportions, levels, and shapes, and converts them into a fully developed building, complete with textures, vegetation, lighting, and an urban context
Mapping Something Unthinkable: Flood Risk in Madrid using Open Data

Dont get wrong if you see the IA background showing our handsome major almost showing his beautiful smile in Cibeles/Correos it’s only to get your attentions (only if you need it thou!). Flooding in urban environments is not a speculative hazard but something we can quantify. In the case of Madrid, the intersection of pretty mountainous terrain (it might surprise you there are 2000m difference between the highest spot in Madrid province, Pico Peñalara -2428m- and the Alberche river environment in some areas -430m-) and urban expansion presents a scenario of significant risk, particularly when analyzed through the lens of shared high-resolution geospatial data. This study integrates the buildings from BTN (Base Topográfica Nacional) provided by the Spanish “IGN”, the CNIG with the official flood hazard maps for a 100-year return period (T=100), published by the Ministry for the Ecological Transition and the Demographic Challenge (MITECO). The T=100 scenario is the most representative for evaluating long-term flood exposure, as it reflects events with a 1% annual probability—rare but not improbable, and certainly not negligible.
Spatial relationship between “high schools” and “betting shops” in Madrid. A first approach (1)

It is a fact that a betting shop should not be close to a secondary school. Its obvious the impact on population ranging 12-17 could be higher than in other. How near? 100m? 500m? Euclidean distance or following the street network?. In any case, if I choose for instance a range of 500m, for example, 81% of betting shops in Madrid have secondary schools within that distance (258 out of 316). Looking at it from the secondary schools’ point of view, almost 60% of secondary schools have betting shops within 500m (171/291). This is undoubtedly an issue that needs to be addressed.
¡Al final se nos quema la península este 2025!

Este agosto, España y Portugal han vivido una temporada de incendios excepcionalmente dura. En España, las llamas han calcinado ~382.000 hectáreas (más de seis veces la media reciente) y han dejado víctimas mortales; en Portugal, las superficies quemadas superan las 200.000 hectáreas, muy por encima del promedio 2006–2024 para estas fechas. El humo cruzó fronteras y degradó la calidad del aire a cientos de kilómetros.
REBATE A TU CUÑADO SOBRE “LLUVIA”

¿Cuántas veces has oído a tu cuñado (o cuñada) decir en una comida familiar frases tipo:
Antes llovía más, se está desertificando todo!”
“¡Yo ya lo noto, desde que era niño no ha vuelto a llover igual!”
En lugar de entrar en debates circulares, te propongo usar Google Earth Engine (GEE), una plataforma gratuita (si demuestras que no vas a usarlo comercialmente, claro) de computación geoespacial en la nube, y una fuente de datos de primer nivel: CHIRPS (Climate Hazards Group InfraRed Precipitation with Station data).
Agricultura de Precisión (I). Uso del Satélite para la toma de decisiones en el campo

Quieres conocer cuál es el momento óptimo para plantar? Para fumigar? Para recolectar?. Sabías que dos de cada tres agricultores no cosechan en la fase de madurez adecuada?. Aquí abajo te describo un método completamente automatizado mediante el uso combinado de varios índices de vegetación como NDVI, NDWI, SAVI y EVI que podemos extraer del Satétile SENTINEL-2 en la plataforma COPERNICUS de la UE para conocer exactamente y anticipar las mejores decisiones de intervención sobre tus tierras.
Spider diagrams in GEE and QGIS

Hace unos días, caminando por una calle concreta —no muy lejos de mi casa, la cual recorro con regularidad— me pregunté cuál era realmente la estación de metro más cercana. Tiendo a pensar que siempre es Puerta del Ángel… y en realidad, lo es. Pero aún así, quise comprobarlo quantitativamente, empíricamente. ¿Y si no fuera tan evidente?
En este tutorial se explica cómo crear un efecto visual dinámico en QGIS que simula una «araña» (ragnetto) que conecta automáticamente los 8 puntos más cercanos al cursor del mouse. Esta funcionalidad permite visualizar relaciones espaciales de forma interactiva y resulta especialmente útil para análisis de proximidad.
