
Dont get wrong if you see the IA background showing our handsome major almost showing his beautiful smile in Cibeles/Correos it’s only to get your attentions (only if you need it thou!). Flooding in urban environments is not a speculative hazard but something we can quantify. In the case of Madrid, the intersection of pretty mountainous terrain (it might surprise you there are 2000m difference between the highest spot in Madrid province, Pico Peñalara -2428m- and the Alberche river environment in some areas -430m-) and urban expansion presents a scenario of significant risk, particularly when analyzed through the lens of shared high-resolution geospatial data. This study integrates the buildings from BTN (Base Topográfica Nacional) provided by the Spanish “IGN”, the CNIG with the official flood hazard maps for a 100-year return period (T=100), published by the Ministry for the Ecological Transition and the Demographic Challenge (MITECO). The T=100 scenario is the most representative for evaluating long-term flood exposure, as it reflects events with a 1% annual probability—rare but not improbable, and certainly not negligible.
Tag Archives: geography
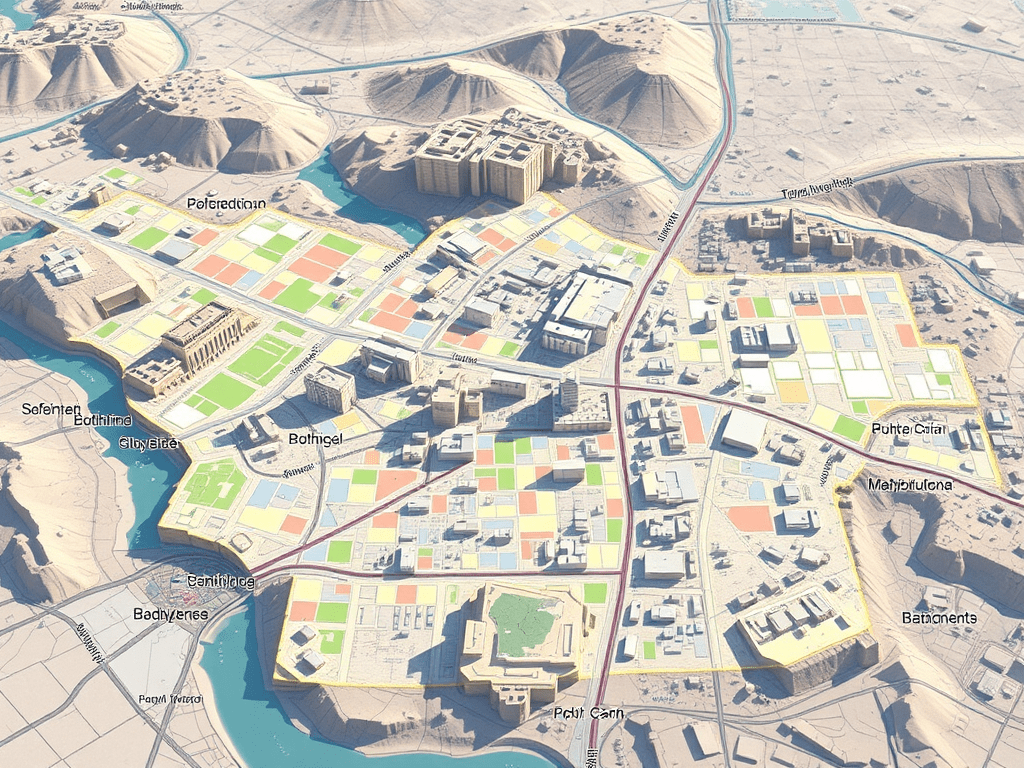
Spatial relationship between “high schools” and “betting shops” in Madrid. A first approach (1)

It is a fact that a betting shop should not be close to a secondary school. Its obvious the impact on population ranging 12-17 could be higher than in other. How near? 100m? 500m? Euclidean distance or following the street network?. In any case, if I choose for instance a range of 500m, for example, 81% of betting shops in Madrid have secondary schools within that distance (258 out of 316). Looking at it from the secondary schools’ point of view, almost 60% of secondary schools have betting shops within 500m (171/291). This is undoubtedly an issue that needs to be addressed.
¡Al final se nos quema la península este 2025!

Este agosto, España y Portugal han vivido una temporada de incendios excepcionalmente dura. En España, las llamas han calcinado ~382.000 hectáreas (más de seis veces la media reciente) y han dejado víctimas mortales; en Portugal, las superficies quemadas superan las 200.000 hectáreas, muy por encima del promedio 2006–2024 para estas fechas. El humo cruzó fronteras y degradó la calidad del aire a cientos de kilómetros.
REBATE A TU CUÑADO SOBRE “LLUVIA”

¿Cuántas veces has oído a tu cuñado (o cuñada) decir en una comida familiar frases tipo:
Antes llovía más, se está desertificando todo!”
“¡Yo ya lo noto, desde que era niño no ha vuelto a llover igual!”
En lugar de entrar en debates circulares, te propongo usar Google Earth Engine (GEE), una plataforma gratuita (si demuestras que no vas a usarlo comercialmente, claro) de computación geoespacial en la nube, y una fuente de datos de primer nivel: CHIRPS (Climate Hazards Group InfraRed Precipitation with Station data).
Agricultura de Precisión (I). Uso del Satélite para la toma de decisiones en el campo

Quieres conocer cuál es el momento óptimo para plantar? Para fumigar? Para recolectar?. Sabías que dos de cada tres agricultores no cosechan en la fase de madurez adecuada?. Aquí abajo te describo un método completamente automatizado mediante el uso combinado de varios índices de vegetación como NDVI, NDWI, SAVI y EVI que podemos extraer del Satétile SENTINEL-2 en la plataforma COPERNICUS de la UE para conocer exactamente y anticipar las mejores decisiones de intervención sobre tus tierras.
Spider diagrams in GEE and QGIS

Hace unos días, caminando por una calle concreta —no muy lejos de mi casa, la cual recorro con regularidad— me pregunté cuál era realmente la estación de metro más cercana. Tiendo a pensar que siempre es Puerta del Ángel… y en realidad, lo es. Pero aún así, quise comprobarlo quantitativamente, empíricamente. ¿Y si no fuera tan evidente?
En este tutorial se explica cómo crear un efecto visual dinámico en QGIS que simula una «araña» (ragnetto) que conecta automáticamente los 8 puntos más cercanos al cursor del mouse. Esta funcionalidad permite visualizar relaciones espaciales de forma interactiva y resulta especialmente útil para análisis de proximidad.
ELEVATION GAIN 84,448 m

On August 14th, 2014, I unknowingly took the first step of a long ascent. Nearly eleven years later, sharply 1089 runs later, I’ve reached an elevation gain of 84,448 metres — almost ten Everests. This isn’t the story of a single mountain climbed, but of a slow, deliberate series of efforts, some before dawn, raining cats and dogs, snowing, escaping from dogs, freezing like hell, others after long days, all contributing to a quiet accumulation of altitude and, more importantly, confidence.
Summer Heat Inequity in Madrid: A Playground-Based Analysis in Summer 2024

Between June 21 and September 21, 2024, I analyzed the surface temperatures of all 2,123 registered playgrounds in Madrid using Landsat 8/9 imagery (Level-2 Surface Temperature products). This investigation, an extension of my previous reflection on urban heat and environmental justice in Geovisualization.net (May 2025), highlights how thermal exposure is patterned by geography, planning legacies, and demographic vulnerability in the Spanish capital.
Urban delineation methods beyond administrative boundaries
As a geographer working with Geographic Information Systems (GIS), I am particularly interested in exploring urban delineation methods that move beyond the constraints of administrative boundaries. Instead of relying on official municipal limits—which can often be outdated or misaligned with functional realities on the ground—I focus on delineating urban areas based on physical indicators such as built-up surface, population density, and spatial continuity. This approach allows for a more accurate and dynamic understanding of urban space.
Urban Heat Islands, Trees, and Climate Justice in the Anthropocene: A Remote Sensing-Based Reflection

In recent years, the need to understand the urban environment has grown more urgent than ever. Climate change is not an abstract future scenario; it is already here, reshaping our cities day by day. Among the many phenomena that demand our attention, the Urban Heat Island (UHI) effect stands out—not only for its environmental and public health impacts but also for its socio-political implications. Through satellite imagery and remote sensing, we can now visualize and quantify these dynamics with increasing precision. This post reflects on such an analysis I conducted using LANDSAT 8 imagery (Scene ID: LC08_L2SP_201032_20250328_20250401_02_T1, Date Acquired: 2025/03/28), and discusses the findings in the broader context of urban planning, climate justice, and the urgent need to protect urban vegetation.
