
Hace unos días, caminando por una calle concreta —no muy lejos de mi casa, la cual recorro con regularidad— me pregunté cuál era realmente la estación de metro más cercana. Tiendo a pensar que siempre es Puerta del Ángel… y en realidad, lo es. Pero aún así, quise comprobarlo quantitativamente, empíricamente. ¿Y si no fuera tan evidente?
En este tutorial se explica cómo crear un efecto visual dinámico en QGIS que simula una «araña» (ragnetto) que conecta automáticamente los 8 puntos más cercanos al cursor del mouse. Esta funcionalidad permite visualizar relaciones espaciales de forma interactiva y resulta especialmente útil para análisis de proximidad.
Tag Archives: sig
Sentinel-1 SAR: Un aliado indispensable para el análisis y seguimiento de inundaciones – Derna, Libia (2023)

La gestión y monitorización de fenómenos hidrológicos extremos, como inundaciones repentinas o fallos estructurales en presas, representan un desafío crítico para los especialistas en geomática, hidrología y planificación territorial. En este contexto, la tecnología radar de apertura sintética (SAR) a bordo del satélite Sentinel-1 de la Agencia Espacial Europea (ESA) ofrece una capacidad sin precedentes para capturar información precisa y fiable sobre la dinámica superficial, independientemente de las condiciones atmosféricas y lumínicas.
Summer Heat Inequity in Madrid: A Playground-Based Analysis in Summer 2024

Between June 21 and September 21, 2024, I analyzed the surface temperatures of all 2,123 registered playgrounds in Madrid using Landsat 8/9 imagery (Level-2 Surface Temperature products). This investigation, an extension of my previous reflection on urban heat and environmental justice in Geovisualization.net (May 2025), highlights how thermal exposure is patterned by geography, planning legacies, and demographic vulnerability in the Spanish capital.
Urban delineation methods beyond administrative boundaries
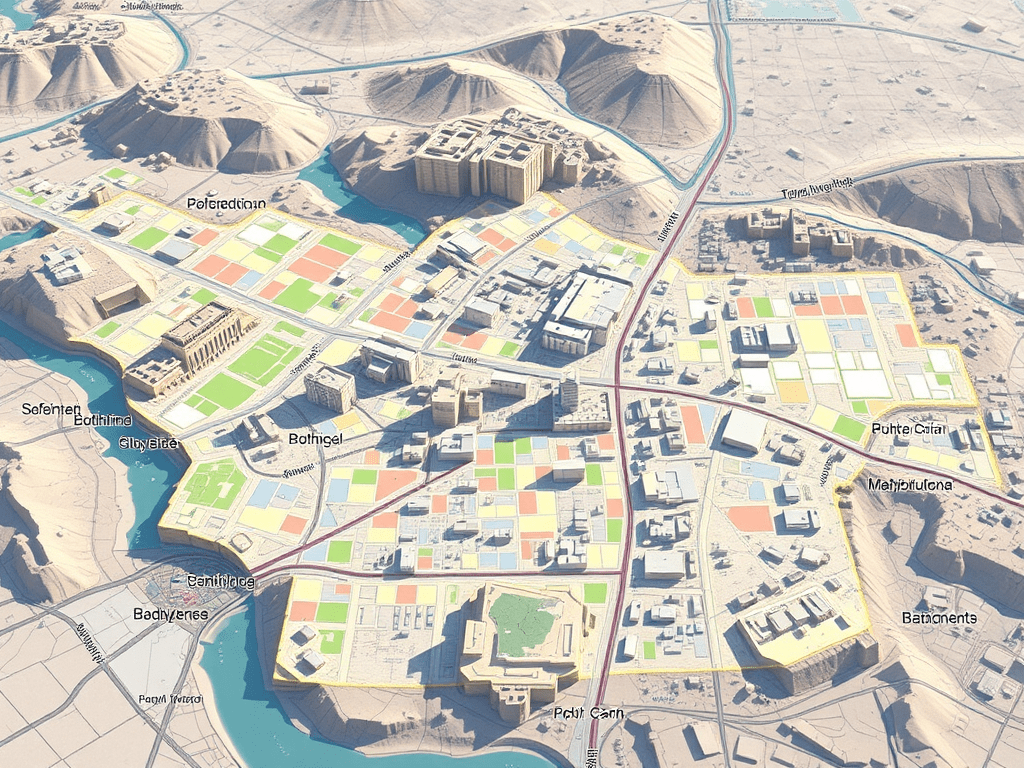
As a geographer working with Geographic Information Systems (GIS), I am particularly interested in exploring urban delineation methods that move beyond the constraints of administrative boundaries. Instead of relying on official municipal limits—which can often be outdated or misaligned with functional realities on the ground—I focus on delineating urban areas based on physical indicators such as built-up surface, population density, and spatial continuity. This approach allows for a more accurate and dynamic understanding of urban space.
Urban Heat Islands, Trees, and Climate Justice in the Anthropocene: A Remote Sensing-Based Reflection

In recent years, the need to understand the urban environment has grown more urgent than ever. Climate change is not an abstract future scenario; it is already here, reshaping our cities day by day. Among the many phenomena that demand our attention, the Urban Heat Island (UHI) effect stands out—not only for its environmental and public health impacts but also for its socio-political implications. Through satellite imagery and remote sensing, we can now visualize and quantify these dynamics with increasing precision. This post reflects on such an analysis I conducted using LANDSAT 8 imagery (Scene ID: LC08_L2SP_201032_20250328_20250401_02_T1, Date Acquired: 2025/03/28), and discusses the findings in the broader context of urban planning, climate justice, and the urgent need to protect urban vegetation.
Mapping My 10-Year Adventure: Running Madrid to Ulaanbaatar 10,127 km

In August 2014, I laced up my running shoes for the first time, with no grand expectations — just a simple desire to move, to feel better, to take control. I was far from athletic: weighing nearly 80 kilograms (almost 20 kg more than today), with no endurance, no rhythm, and definitely no running background (exception made of some runs in my mid 20’s :-)). But I made myself a promise: I would be stubborn, consistent, and patient. No matter the weather — rain, wind, snow, scorching heat, storms — I would run, three times a week, every week.
GEOGRAFÍA EN EL COLEGIO!

Ayer tuve el honor de compartir una hora y media con la clase de 2ºA de primaria del Colegio Ermita del Santo en Madrid, hablando sobre Geografía desde muchos puntos de vista. Desde las proyecciones cartográficas hasta Google Earth, pasando por un proyecto cartográfico real y reciente, y terminando con la relación entre la Geografía y la Meteorología. Pero lo más especial no fueron los mapas ni las explicaciones… ¡fueron las preguntas!
LOS ANGELES WILDFIRES 2025: Sentinel 2 +Overpass Turbo (OSM)

En Los Ángeles, la combinación de condiciones meteorológicas, como los vientos secos de Santa Ana y las altas temperaturas, crea un entorno propenso a incendios forestales. Estos fuegos, a menudo cercanos a áreas urbanas, representan un gran desafío para la gestión de emergencias. Aquí es donde Sentinel-2 se convierte en una herramienta crucial. Utilizando la combinación de bandas 12, 8, 4, Sentinel-2 permite detectar rápidamente focos de calor y evaluar la extensión de las áreas quemadas, lo que es vital para coordinar respuestas eficaces. Esta capacidad de monitoreo casi en tiempo real es fundamental para mitigar el impacto de los incendios y proteger tanto a las comunidades como a los ecosistemas.
Palestine 2023-2024

The 7th of October will forever be remembered in our collective memory as a day of tragedy and senseless violence, an operation that would shatter the dream of Israel’s inviolability. The attacks by Hamas were unequivocally condemnable. The targeting of civilians (+1200 dead and +250 kidnappings) is never acceptable, and those responsible for such acts must be held accountable. However, the response that followed has escalated into something far worse, a state-driven campaign of violence by Israel that has, in just one year, claimed over 42,000 lives, a staggering number of whom are women and children. This is not defense; this is mass murder. GENOCIDE.
Wildfires in Russia through SENTINEL 2

In recent days, the Sakha region in Russia has experienced significant wildfire activity, More than 100 wildfires spanning more than 300,000 hectares are currently active. driven by a combination of extreme weather conditions and environmental factors. The fires, which have spread across vast areas of forest and tundra, have been exacerbated by unusually high temperatures and prolonged periods of drought. These conditions have led to exceptionally dry vegetation, creating an ideal fuel for the fires.
