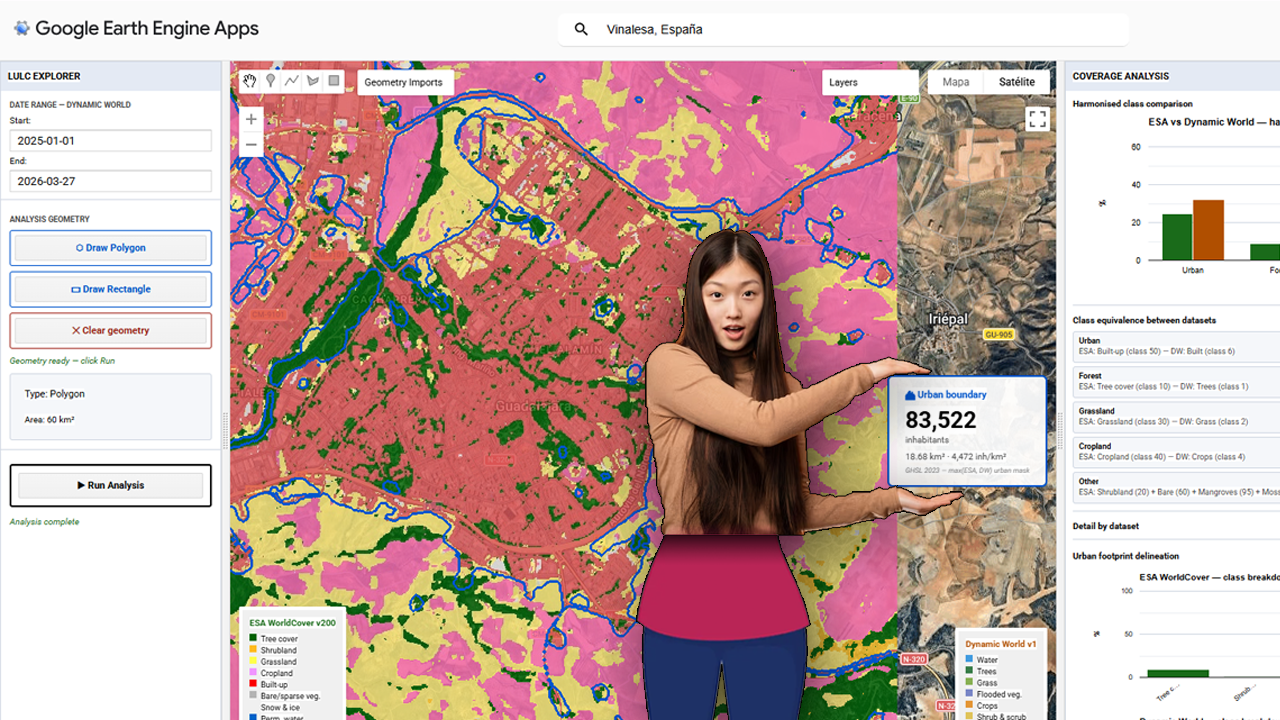
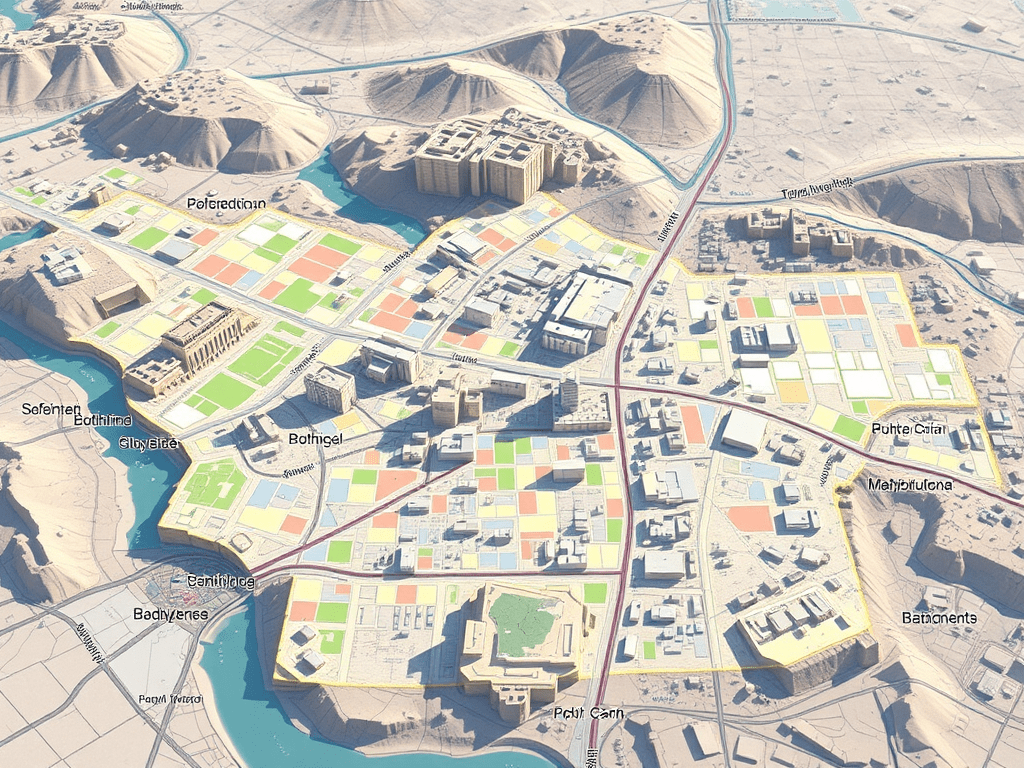
The foundational step of this methodology involves the deployment of a centralized processing interface within the Google Earth Engine (GEE) environment. The provided visualization captures the core interface of the custom GEE application, which serves as the hub for the multi-sensor LULC validation pipeline. Within this dashboard, users can define a specific Area of Interest (AOI)—highlighted here over the Iberian Peninsula and North Africa—and configure key parameters, including temporal ranges for the acquisition of sentinel-derived products. Crucially, the interface is designed to load and compare two primary datasets simultaneously: Dynamic World (near real-time, probability-based LULC) and ESA WorldCover (10m resolution structured LULC). The contrasting classification schemes are represented by the legends on the left and right sides of the map view, which illustrate the varying definitions of ‘Built-up’ and urban areas between the two products. Establishing this visual and statistical comparison at the application level is the prerequisite for calculating the spatial disagreement threshold, or delta, that guides the subsequent merging and population estimation phases.
Category Archives: landuse
Agricultura de precisión (II). APP para integración con Catastro rural en España
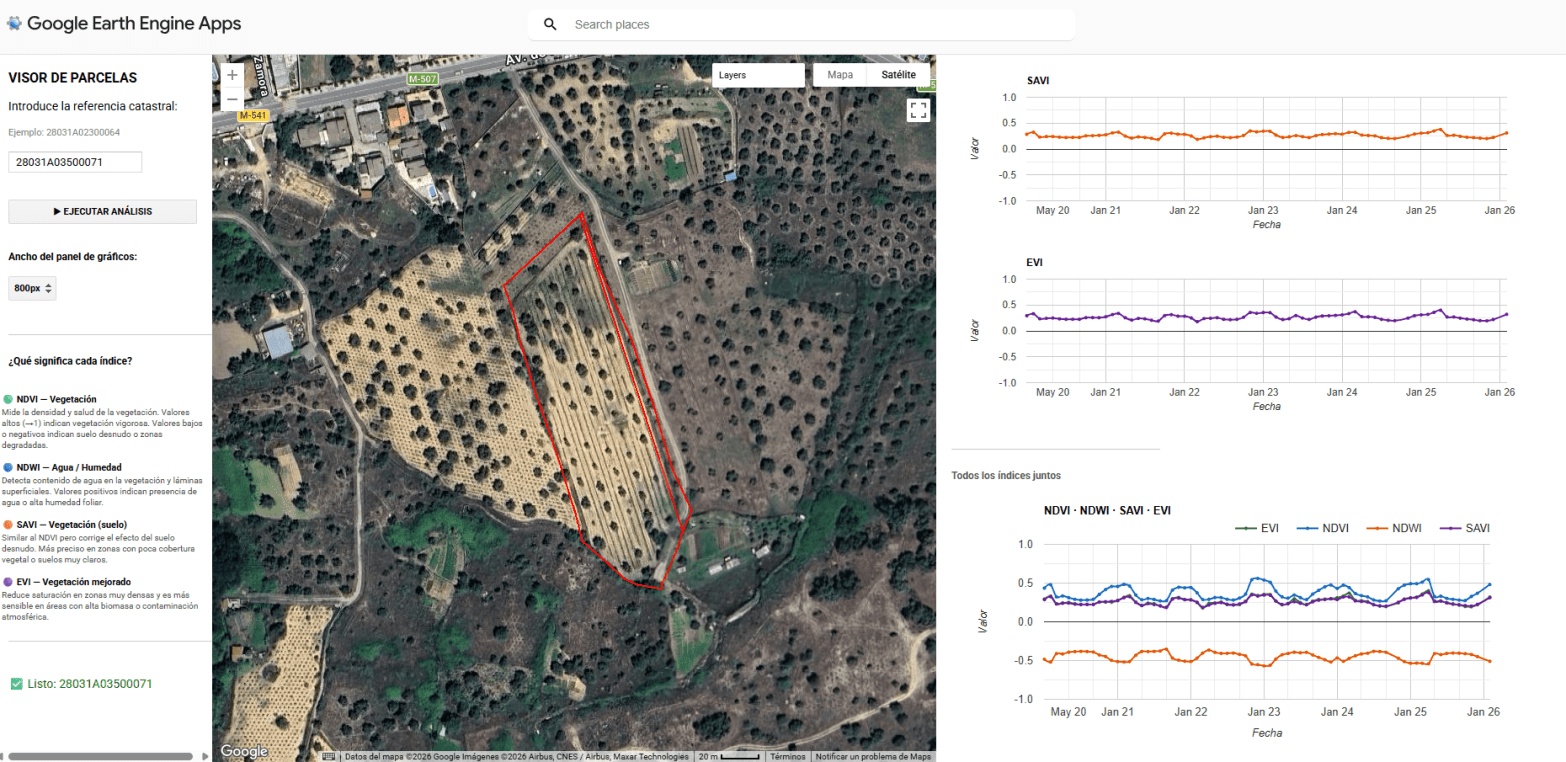
La convergencia entre el Big Data geoespacial y la administración pública ofrece una oportunidad sin precedentes para la optimización agronómica. La capacidad de procesamiento de Google Earth Engine (GEE), vinculada a la cartografía vectorial del Catastro rural, permite transformar las series temporales de misiones como Sentinel-2 en herramientas de diagnóstico directo sobre la parcela. Este enfoque desplaza el análisis de una observación puramente visual a una monitorización cuantitativa basada en la respuesta espectral de los cultivos. El núcleo de esta aplicación reside en la intersección geométrica de las parcelas catastrales con colecciones de imágenes multiespectrales. Mediante el uso de la API de JavaScript en GEE, se automatiza el cálculo de indicadores biofísicos críticos como el NDVI (Índice de Vegetación de Diferencia Normalizada), el NDWI (Índice de Agua de Diferencia Normalizada), el EVI (Índice de Vegetación Mejorado) y el SAVI (Índice de Vegetación Ajustado al Suelo). Estos índices no solo reflejan el vigor fotosintético, sino que permiten identificar anomalías de crecimiento, estrés hídrico o variaciones en la densidad foliar que son invisibles al ojo humano en las fases tempranas del ciclo fenológico.
Super-résolution 1 m a Cadalso de los Vidrios, Madrid avec Sentinel 2 (10m). Magique !
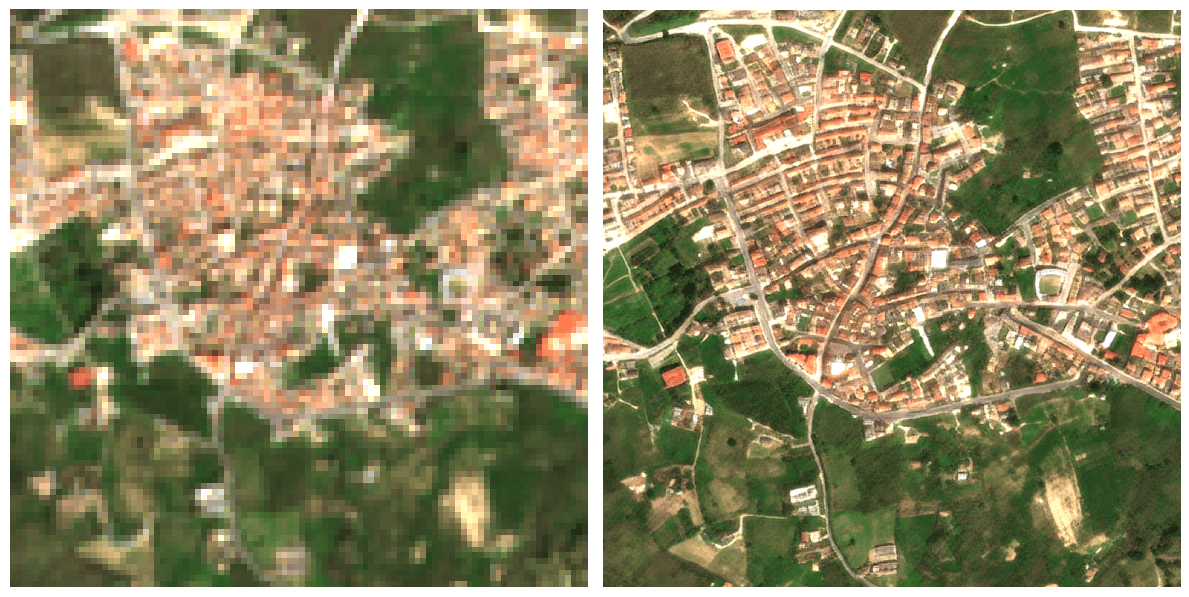
Passer d’une résolution de 10 mètres à 1 mètre change radicalement la perspective du suivi agricole : on ne regarde plus une parcelle dans sa globalité, on observe ce qui se passe à l’intérieur même des rangs de culture. Ce saut qualitatif est possible grâce à l’algorithme S2DR3, un modèle de Deep Learning qui ne se contente pas d’agrandir les pixels, mais reconstruit l’information manquante. En s’appuyant sur les corrélations entre les différentes bandes spectrales de Sentinel-2 et en s’entraînant sur des images de très haute résolution, l’IA parvient à synthétiser une image à 1 m/pixel d’une précision étonnante.
ESTIMATED GHSL vs INE 2025
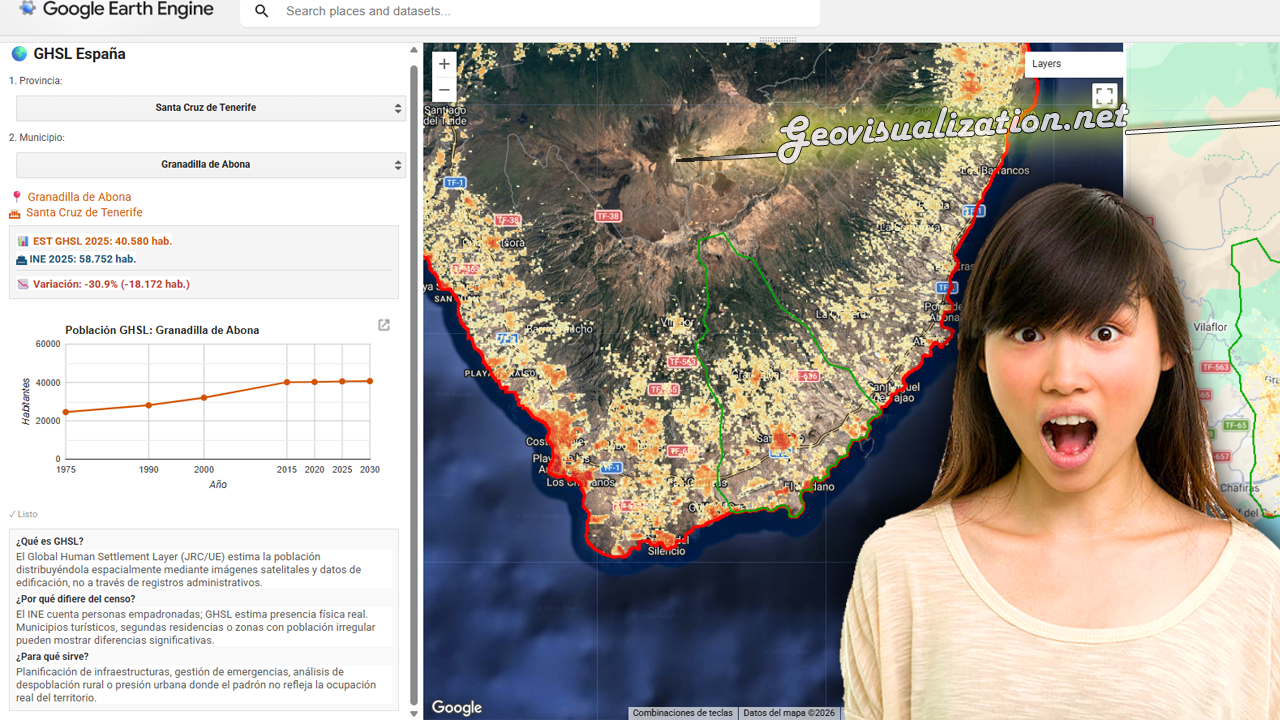
He desarrollado este COMPARADOR DE POBLACIÓN GHSL vs PADRÓN INE 2025 en JavaScript/Google Earth Engine que cruza estimaciones satelitales de población con los datos oficiales del censo español municipio a municipio.
La herramienta permite seleccionar cualquier provincia y municipio de España, visualizar la distribución espacial de población estimada por el GHSL con el último dato oficial del INE 2025, detectando municipios con alta presión turística, despoblación real o población no registrada.
Una aplicación directa para planificación de infraestructuras, gestión de emergencias o análisis de cohesión territorial donde el padrón no refleja la ocupación real del territorio.
URBAN ATLAS 2018 + WORLDPOP 100m/GHSL 100m estimates over Madrid
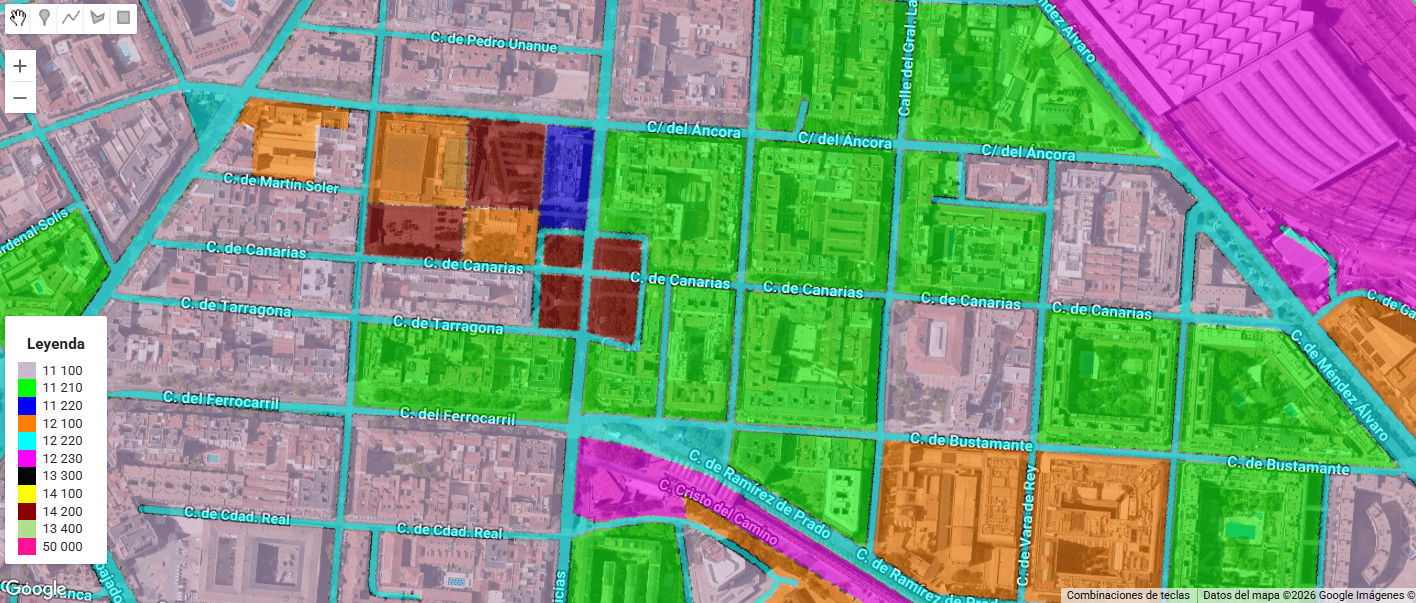
Urban Atlas (UA) representa el estándar de oro dentro del Copernicus Land Monitoring Service (CLMS) para el análisis de la morfología urbana en Europa. A diferencia de Corine Land Cover, UA ofrece una resolución temática y espacial drásticamente superior (Unidad Mínima de Mapeo de 0.25 ha para clases urbanas), permitiendo discriminar entre tejidos urbanos continuos y discontinuos con una precisión de densidad del 10% al 80%.
Precision Elevation Data for Forest Giants: LiDAR vs ETH Global Canopy Height in Mata do Buçaco (Portugal)

High‑resolution elevation data underpins almost every spatial analysis we do in GIS—especially in forests where vertical structure defines habitat, biomass, wind exposure, fire behavior, hydrology, and the microclimates that sustain rare species. In rugged or densely vegetated environments, a coarse or biased elevation model propagates error everywhere: orthorectification drifts, hillshades mislead, slope/aspect misclassify, and canopy metrics saturate. The result is decisions made on blurred terrain that hides the very patterns we seek to manage. Precision elevation—derived from airborne LiDAR (Light Detection and Ranging)—solves this by separating the ground from the vegetation and delivering both a bare‑earth Digital Terrain Model (DTM) and a Digital Surface Model (DSM). Subtracting DTM from DSM gives a Canopy Height Model (DHM) that captures the true vertical architecture of the forest at sub‑meter resolution.
Agricultura de Precisión (I). Uso del Satélite para la toma de decisiones en el campo

Quieres conocer cuál es el momento óptimo para plantar? Para fumigar? Para recolectar?. Sabías que dos de cada tres agricultores no cosechan en la fase de madurez adecuada?. Aquí abajo te describo un método completamente automatizado mediante el uso combinado de varios índices de vegetación como NDVI, NDWI, SAVI y EVI que podemos extraer del Satétile SENTINEL-2 en la plataforma COPERNICUS de la UE para conocer exactamente y anticipar las mejores decisiones de intervención sobre tus tierras.
Sentinel-1 SAR: Un aliado indispensable para el análisis y seguimiento de inundaciones – Derna, Libia (2023)

La gestión y monitorización de fenómenos hidrológicos extremos, como inundaciones repentinas o fallos estructurales en presas, representan un desafío crítico para los especialistas en geomática, hidrología y planificación territorial. En este contexto, la tecnología radar de apertura sintética (SAR) a bordo del satélite Sentinel-1 de la Agencia Espacial Europea (ESA) ofrece una capacidad sin precedentes para capturar información precisa y fiable sobre la dinámica superficial, independientemente de las condiciones atmosféricas y lumínicas.
Urban delineation methods beyond administrative boundaries
As a geographer working with Geographic Information Systems (GIS), I am particularly interested in exploring urban delineation methods that move beyond the constraints of administrative boundaries. Instead of relying on official municipal limits—which can often be outdated or misaligned with functional realities on the ground—I focus on delineating urban areas based on physical indicators such as built-up surface, population density, and spatial continuity. This approach allows for a more accurate and dynamic understanding of urban space.
Urban Heat Islands, Trees, and Climate Justice in the Anthropocene: A Remote Sensing-Based Reflection

In recent years, the need to understand the urban environment has grown more urgent than ever. Climate change is not an abstract future scenario; it is already here, reshaping our cities day by day. Among the many phenomena that demand our attention, the Urban Heat Island (UHI) effect stands out—not only for its environmental and public health impacts but also for its socio-political implications. Through satellite imagery and remote sensing, we can now visualize and quantify these dynamics with increasing precision. This post reflects on such an analysis I conducted using LANDSAT 8 imagery (Scene ID: LC08_L2SP_201032_20250328_20250401_02_T1, Date Acquired: 2025/03/28), and discusses the findings in the broader context of urban planning, climate justice, and the urgent need to protect urban vegetation.
