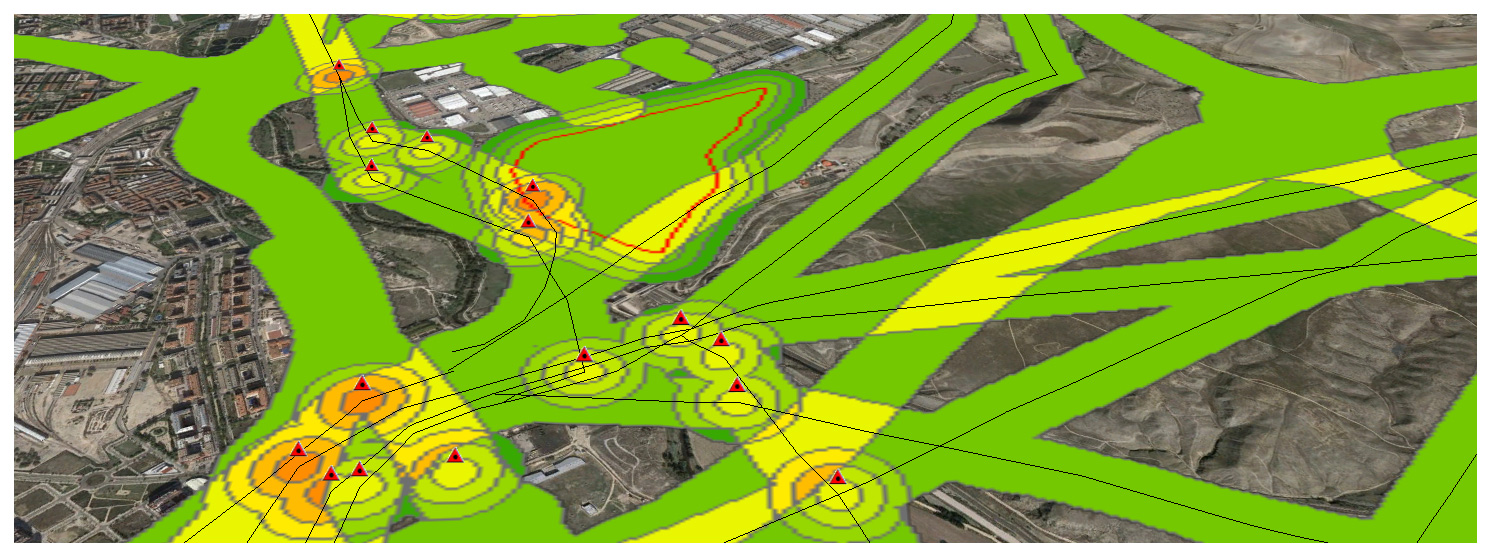
Now that we have completed a first example, let’s continue with a real-world one. Its important working on a Data Model to define what we understand as a Risk and how important this is. Meaning. High voltage power lines are an actual risk but the closer we are, i guess the bigger the risk is, meaning i.e 3 if we are within 50m and 1 if we are 150m away… It’s only a guess.
Category Archives: análisis
Risk exposure. First steps

Knowing how to geoprocess features is key if what we want is assesing risk exposure. What’s a risk? Which are the risks? Where are the risks? How important a risk is?
Jugando con CartoDB

Hace ya mucho tiempo que he oído hablar de CartoDB y que vengo practicando en su página web a visualizar bases de datos sencillas. Crea una cuenta Incorpora tus datos o tómalos de la galería Selecciona en modo datos la columna que quieres simbolizar/visualizar Conviértela en NUMBER si estuviera en STRING Selecciona en modo mapaContinue reading “Jugando con CartoDB”
Change detection – Detección de cambios en polígonos
THE PROCEDURE: Centroids of buildings; Spatial join showing presence-absence, considering a 10m accuracy threshold, meaning if the centroid has not moved more than 10m, its the same building. If the centroid in 2012 is not in 2014, its considered as demolished. If a new centroid appears its considered new building.
Tipologías usuarios Madrid Río. Estadísticas y tendencias interesantes
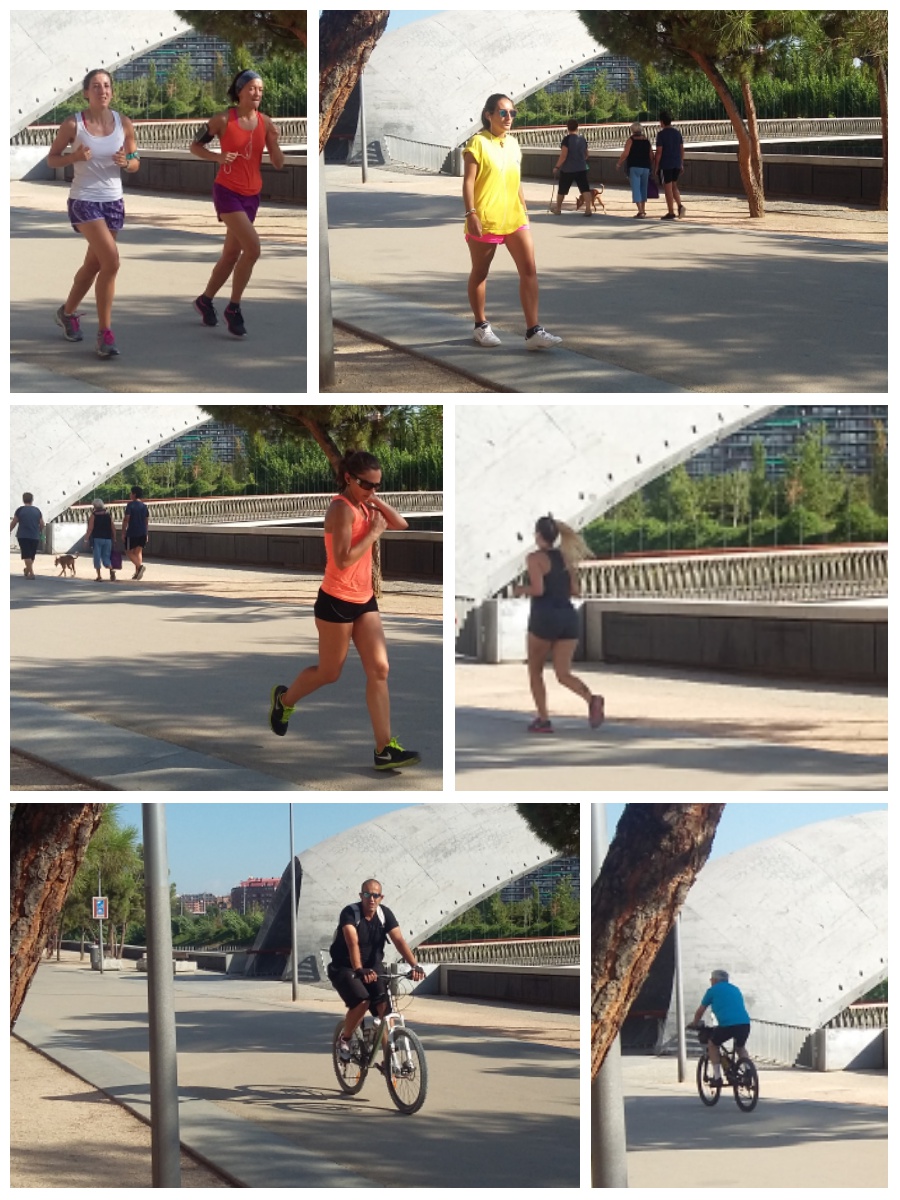
Para la multitud de personas a las que como a mí, les ha sorprendido esta infrastructura en frente de sus casas hay posibilidad de encontrarse en el mismo metro cuadrado a alguien corriendo, alguien andando, una pareja con un carrito de niños, unos amigos en patines, alguna persona en bici… unos más rápido y unos más lento, todos hemos de convivir en un trazado de unos 7,5km de largo y no más unos metros de ancho, con lo que unas mínimas normas de circulación se imponen.
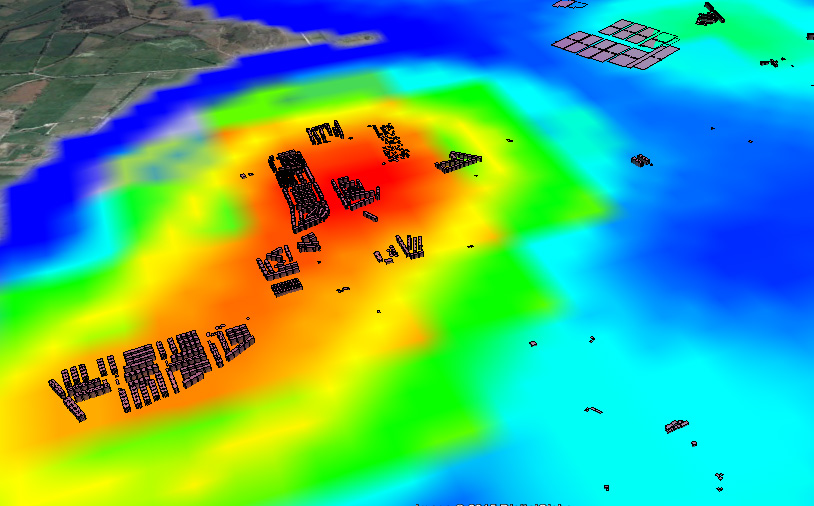
DTM validation using Google Earth (and RMSE extraction)
Hi guys, Surfing the internet is great when you need to figure out something. I needed to validate some DTM from unknown sources against an also unknown source (but at least a kind of reliable one, Google Earth). All we need is Google Earth TCX converter ARcGIS Excel This is the procedure i have followed:Continue reading “DTM validation using Google Earth (and RMSE extraction)”
Pearson correlation and GIS
Do these two variables have a correlation?. To answer this important question first of all we have to know that only if it’s a linear relationship and there are no outliers we can take advantage of Mr Pearson’s correlation statiscal tool. If i love chocolate, does this mean i have tendency of being chuby? orContinue reading “Pearson correlation and GIS”
Comparing France Meteo and Spain Meteo from the visualization point of view
After living in France for four years i have to tell i am always aware of Meteo information on TV (well, i live in Brittany, i guess this makes sense!). It was the same in Spain or anywhere else in the world where i had lived and the reason why is i have always lovedContinue reading “Comparing France Meteo and Spain Meteo from the visualization point of view”
Advanced Thematic Cartography IGN Spain
A few lines for leting you know i passed this course last year 2013 in Instituto Geográfico of Spain (IGN). Spatial analysis, Spatial stats, proper simbolization, data mining and geovisualization. A very interesting 40h online course that helps me on a daily basis to be able to show geodata in a more professional way. BecauseContinue reading “Advanced Thematic Cartography IGN Spain”
HTML High resolution DTM visualization using QGIS
This QGIS Plugin, Qgis2threejs, exports terrain data, map canvas image and vector data to your web browser!! All you have to do is opening the DTM in QGIS (2.4.0 Chugiak), go to plugins library and install Qgis2threejs. Once its installed you will see this icon on screen and you will need to clic on it. ThenContinue reading “HTML High resolution DTM visualization using QGIS”
