
Ce fichier est une version consolidée des sources suivantes: Stations Tesla, Bornes de la Métropole de Rennes, Bornes dans les Concessions Renault, Bornes Autolib’, Plus de Bornes, opérateur en Provence, Compagnie Nationale du Rhône, Magasins E.Leclerc
Category Archives: análisis
Homicidio doloso en Ciudad de México 2013-2015

Recibí este link por Facebook hace un rato (Gracias Paco!)… https://hoyodecrimen.com/mapa#/19.4052/-99.0987/12 y me dediqué unos minutos a analizar un hecho puntual, el homicidio doloso, en un periodo concreto de tiempo, de 2013 a 2015. Veamos la previsualización de todos los homicidios ocurridos en 2013 en CARTO. El autor de la página llamada CRIMEN POR TUContinue reading “Homicidio doloso en Ciudad de México 2013-2015”
Euclidean allocation analysis II

Imagine you need to promote recycling. Imagine you have 1000 inhabitants from a small village and you need to provide proper colored plastic bags for each and every one of the categories you need to disaggregate: organic, plastic and paper. You need to service them all properly but you can only choose 5 shops (out of theContinue reading “Euclidean allocation analysis II”
Allocation analysis: Attaching customers to facilities
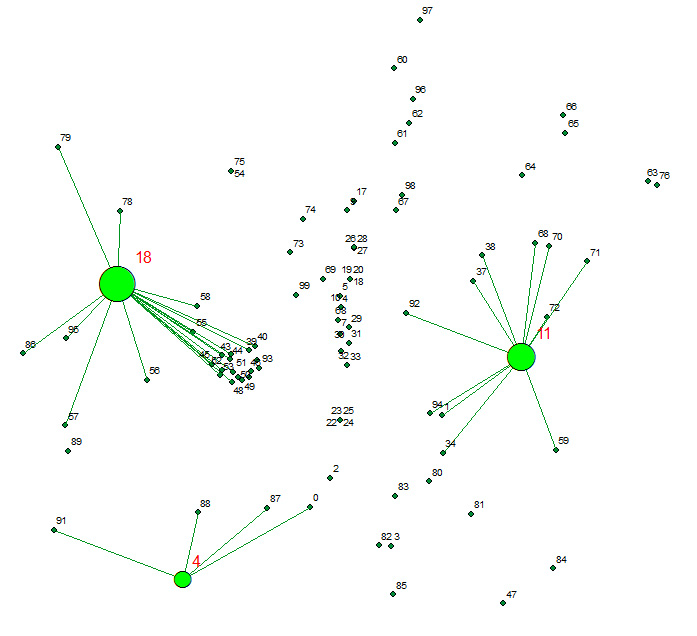
Allocates a set of demand points (Customers) to user specified number of supply points (Facilities) out of a Facilities point dataset based on the Euclidian distance between the Customers and Facilities.
Running en Nantes

Cada vez que corría por esta maravillosa ciudad, lo grababa con la aplicación Runkeeper, así que he superpuesto todas las ocasiones para ver dónde exactamente se concentran las rutas que más he usado y las zonas por las que he pasado más veces. Esto es lo mal de concentrar en la misma persona alguien alContinue reading “Running en Nantes”
Réalisation du carte de densité pour vérifier Localisation des colonnes aériennes de Nantes Métropole

Localisation et caractéristiques des colonnes d’apport volontaire aériennes de Nantes Métropole utilisées pour la collecte des déchets. Outil de visualisation Global Mapper 17 Format SHP champ: VOLUME http://data.paysdelaloire.fr/donnees/detail/localisation-des-colonnes-aeriennes-de-nantes-metropole/ Ces colonnes sont implantées sur l’ensemble du territoire et sont destinées à la collecte du verre et des emballages recyclables (papier, carton, plastique). C’est genial jouer unContinue reading “Réalisation du carte de densité pour vérifier Localisation des colonnes aériennes de Nantes Métropole”
Visualizing Tweets!
How about a quick visualization of tweets in CartoDB? Hey guys, the way we used to visualize is changing on a daily basis so it’s time to catch up!!!. Let’s add a timestamp and play!! We will take a look at this dataset in depth shortly so be aware of our schedule! Regards, Alberto C.MScContinue reading “Visualizing Tweets!”
Creating value through Open Data

The benefits of Open Data are diverse and range from improved efficiency of public administrations, economic growth in the private sector to wider social welfare (Source: http://www.europeandataportal.eu/) Performance can be enhanced by Open Data and contribute to improving the efficiency of public services. Greater efficiency in processes and delivery of public services can be achieved thanks toContinue reading “Creating value through Open Data”
Comparación de DTM usando Global Mapper 17.0.1

Comparar, primero visualmente y después cuantitativamente dos DTM. Por un lado elegimos una fuente muy usual, SRTM con un DTM derivado de Fotogrametría Stereo.
Descargas del CNIG. Open Source bien hecho!

Hola amigos del GIS, Por motivos de trabajo que no vienen al caso, he tenido que bucear de manera sistemática la web de descargas del CNIG. http://centrodedescargas.cnig.es/CentroDescargas/inicio.do Una maravilla. Por motivos que tampoco viene al caso, he de hacer esto mismo de vez en cuando en todos los Institutos cartográficos del mundo y el delContinue reading “Descargas del CNIG. Open Source bien hecho!”
