
Como vemos en el ejemplo del volcán de La Palma, después de la reciente erupción del 19 de Septiembre, las bandas del infrarrojo de onda corta (SWIR) identifican variaciones de temperatura en superficie, por lo que las composiciones RGB a falso color, combinando bandas SWIR y bandas en el visible, son perfectas para identificar el curso de la colada de lava a lo largo del tiempo.
Category Archives: noticias
Análisis TIA 14d COVID en Madrid a 20210527
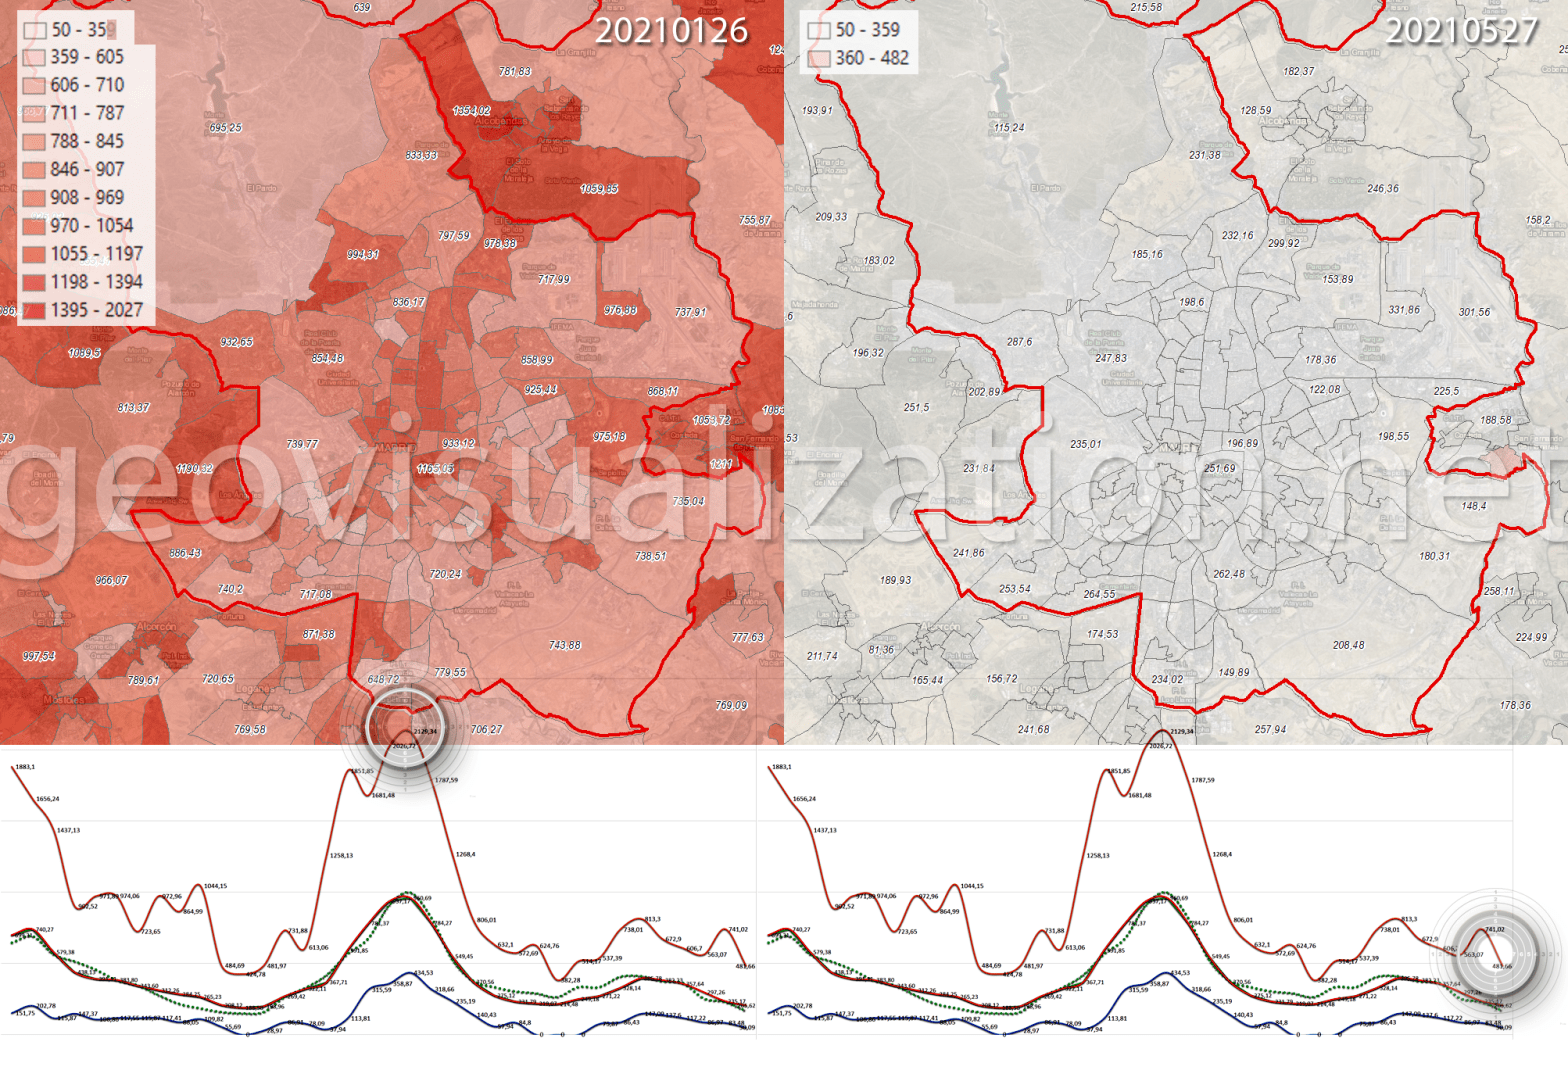
Sirva este mapa como seguimiento de los anteriores. Sin entrar en más detalles, todo sigue en orden descendente. no solo la media de las 263 ZBS sino los máximos bajan y los mínimos también.
Análisis TIA 14d COVID en Madrid a 20210518

Simplemente como update del post anterior y para ver el proceso de semana en semana. Todo indica que salvo excepciones, la bajada de Tasa de Incidencia Acumulada a 14 días por cada 100,000 habitantes por Zonas Básicas de Salud en la Comunidad de Madrid es unánime y ya no hay ni una sola Zona Básica de Salud en todo Madrid que esté con limitaciones de movilidad.
Old non internet times and a few different ways of visualizing wind in VENTUSKY application

Have you seen how this helps you to understand the way wind flows? (switching form different variables visualization styles)
Hipsters in USA. Sample over ALABAMA State

Isn’t it incredible? Mapping qualitative data, something as intangible as mapping a concept. For the first time, human behavior and personality in communities can be quantified using artificial intelligence.
Census differential Privacy Exploration: the change in population for every Congressional district after applying Differential Privacy
How differences in population count could have implications for service provision, allocation of funds, & political representation. Source: https://www.caliper.com/census-differential-privacy-maps/ The U.S. Census Bureau has changed the way it ensures privacy for the 2020 Census. The new method is called Differential Privacy (DP). To help people assess some of the implications and unintended consequences of Differential Privacy, Caliper® is providing severalContinue reading “Census differential Privacy Exploration: the change in population for every Congressional district after applying Differential Privacy”
Seminario motivacional en el Máster Tecnologías de la Información Geográfica de la UAH
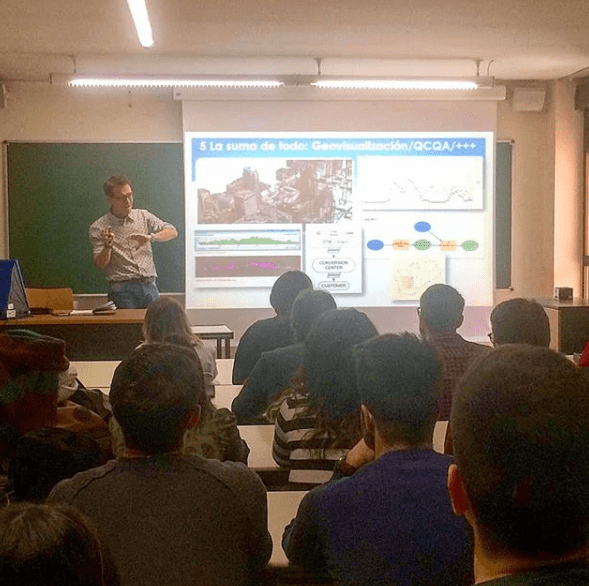
Esta vez me tocó impartir el seminario motivacional “Geógrafos en tiempos de GIS” en el entorno del Máster de Tecnologías de la Información Geográfica. Yo encantado pues este mismo máster lo cursó yo hace ya doce años (wow, time flies, el tiempo pasa rápidamente cómo dicen!) y la verdad es que me encantó hacerlo.
+53,000 visits from 166 countries!!

This is just for leting you guys know i have received visits from almost all over the world
Análisis de la inundación en Sant Llorenç des Cadassar (Baleares, España) en Octubre 2018

Esta simulación con datos reales permite constatar empíricamente la pésima ubicación del pueblo en medio del cauce de un torrente al mismo tiempo que muestra lo osado de no gastar el dinero suficiente en infrastructuras que salven la vida de los habitantes de un entorno potencialmente peligroso en situaciones de borrascas ocluídas (gotas frías) o ciclogénesis expansivas, tan comunes en esta epoca del año por esta zona.
BGS Geology of Britain: Geovisualization 100%

Oh! a must see: BGS Geology of Britain. Source from http://www.bgs.ac.uk/discoveringGeology/geologyOfBritain/home.html Britain is fortunate in possessing a remarkably varied geology within a relatively small area. The rocks that make up our islands represent a long and complicated history of events. They encompass most of the major periods of geological time and extremes of climate from desert toContinue reading “BGS Geology of Britain: Geovisualization 100%”
