
Just come back from Chile, Peru and Colombia, where my employer held some conferences on Smart Cities. I had the chance to talk in both venues: GIS expertise, geoprocessing, spatial analysis, etc. This is all about GIS, as always lately 😉 Our Smart City conferences and workshops held this month have been a great success!Continue reading “LATAM tour on Smart Cities”
Tag Archives: sig
BGS Geology of Britain: Geovisualization 100%

Oh! a must see: BGS Geology of Britain. Source from http://www.bgs.ac.uk/discoveringGeology/geologyOfBritain/home.html Britain is fortunate in possessing a remarkably varied geology within a relatively small area. The rocks that make up our islands represent a long and complicated history of events. They encompass most of the major periods of geological time and extremes of climate from desert toContinue reading “BGS Geology of Britain: Geovisualization 100%”
Visualizar mapas animados en el tiempo: Seguimiento de aves en CARTO [ENG]
SuperinteresantE demo para ‘jugar’con datos reales georeferenciados desde la aplicación CARTO. Tres aves migrando desde El Norte de Europa hasta el África subsahariana. Source: https://carto.com/learn/guides/styling/animating-maps-with-point-data This guide describes how to visualize point data over time, by applying the ANIMATED aggregation style to animate your map. This feature requires a map layer containing point geometries withContinue reading “Visualizar mapas animados en el tiempo: Seguimiento de aves en CARTO [ENG]”
Euclidean allocation analysis II

Imagine you need to promote recycling. Imagine you have 1000 inhabitants from a small village and you need to provide proper colored plastic bags for each and every one of the categories you need to disaggregate: organic, plastic and paper. You need to service them all properly but you can only choose 5 shops (out of theContinue reading “Euclidean allocation analysis II”
Creating value through Open Data

The benefits of Open Data are diverse and range from improved efficiency of public administrations, economic growth in the private sector to wider social welfare (Source: http://www.europeandataportal.eu/) Performance can be enhanced by Open Data and contribute to improving the efficiency of public services. Greater efficiency in processes and delivery of public services can be achieved thanks toContinue reading “Creating value through Open Data”
Descargas del CNIG. Open Source bien hecho!

Hola amigos del GIS, Por motivos de trabajo que no vienen al caso, he tenido que bucear de manera sistemática la web de descargas del CNIG. http://centrodedescargas.cnig.es/CentroDescargas/inicio.do Una maravilla. Por motivos que tampoco viene al caso, he de hacer esto mismo de vez en cuando en todos los Institutos cartográficos del mundo y el delContinue reading “Descargas del CNIG. Open Source bien hecho!”
Cheers! Geovisualization.net has just been released!
Helo everybody. Geovisualization.net has just been released. Hope you like it.
Risk exposure. Geoprocessing using Open Source Data!! Next steps!!
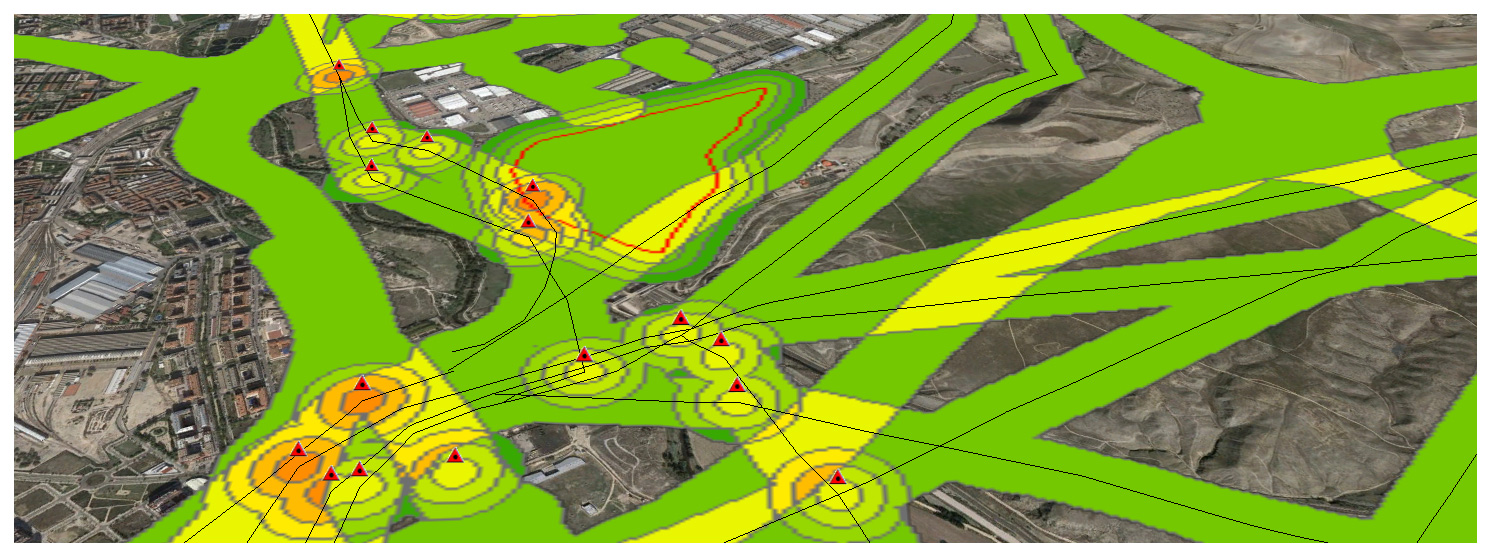
Now that we have completed a first example, let’s continue with a real-world one. Its important working on a Data Model to define what we understand as a Risk and how important this is. Meaning. High voltage power lines are an actual risk but the closer we are, i guess the bigger the risk is, meaning i.e 3 if we are within 50m and 1 if we are 150m away… It’s only a guess.
Risk exposure. First steps

Knowing how to geoprocess features is key if what we want is assesing risk exposure. What’s a risk? Which are the risks? Where are the risks? How important a risk is?
Jugando con CartoDB

Hace ya mucho tiempo que he oído hablar de CartoDB y que vengo practicando en su página web a visualizar bases de datos sencillas. Crea una cuenta Incorpora tus datos o tómalos de la galería Selecciona en modo datos la columna que quieres simbolizar/visualizar Conviértela en NUMBER si estuviera en STRING Selecciona en modo mapaContinue reading “Jugando con CartoDB”
