C’est vraiment magnifique l’ouverture des données publiques… Je vais décrire mon itinéraire pour mieux comprendre:
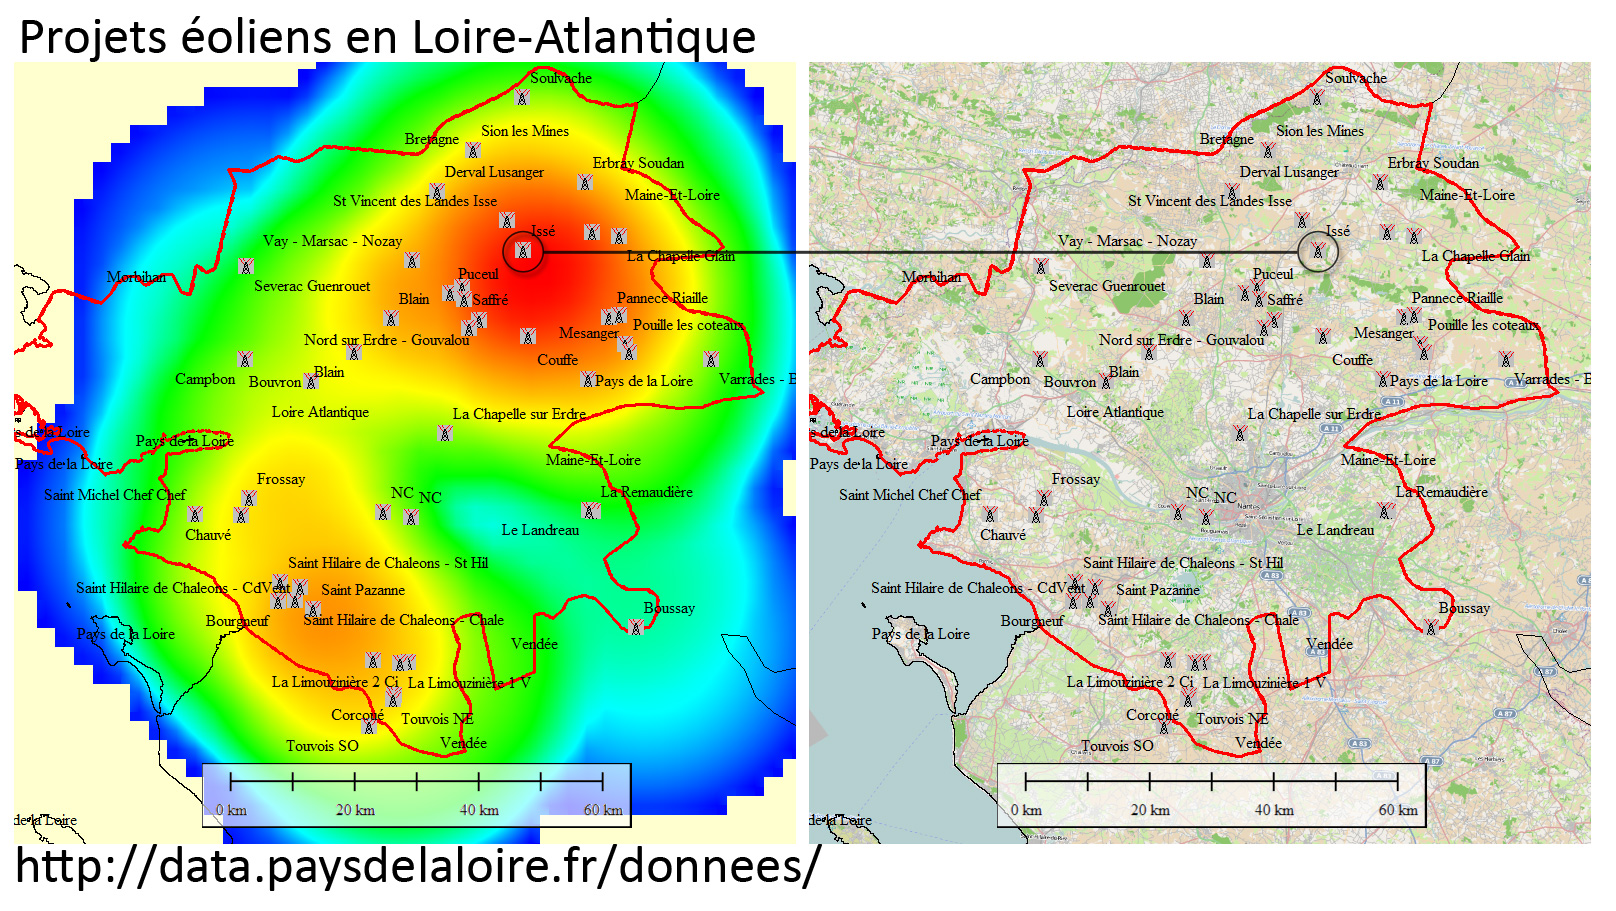
- Télécharger des données (Projets éoliens en Loire-Atlantique)
- Telecharger DTM (SRTM v4)
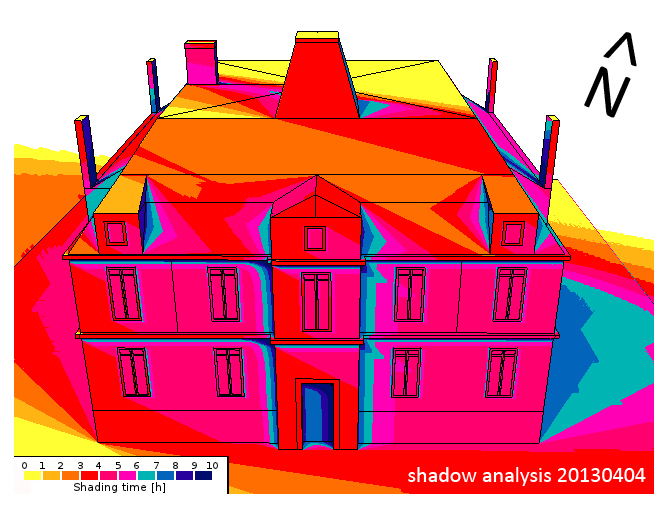
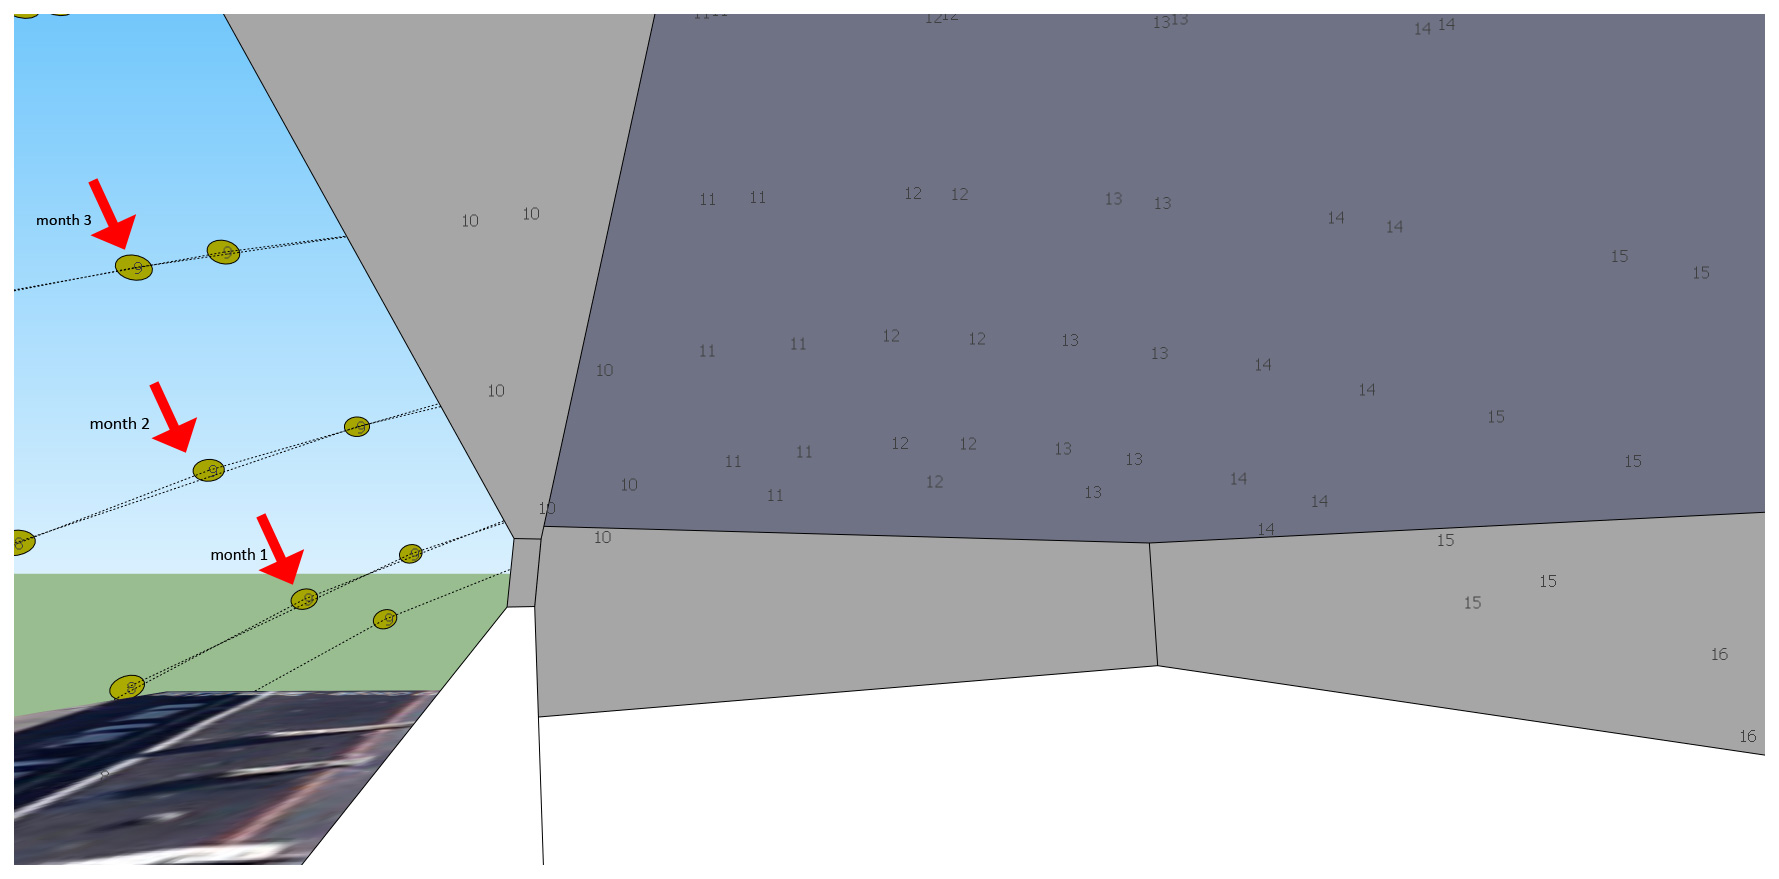
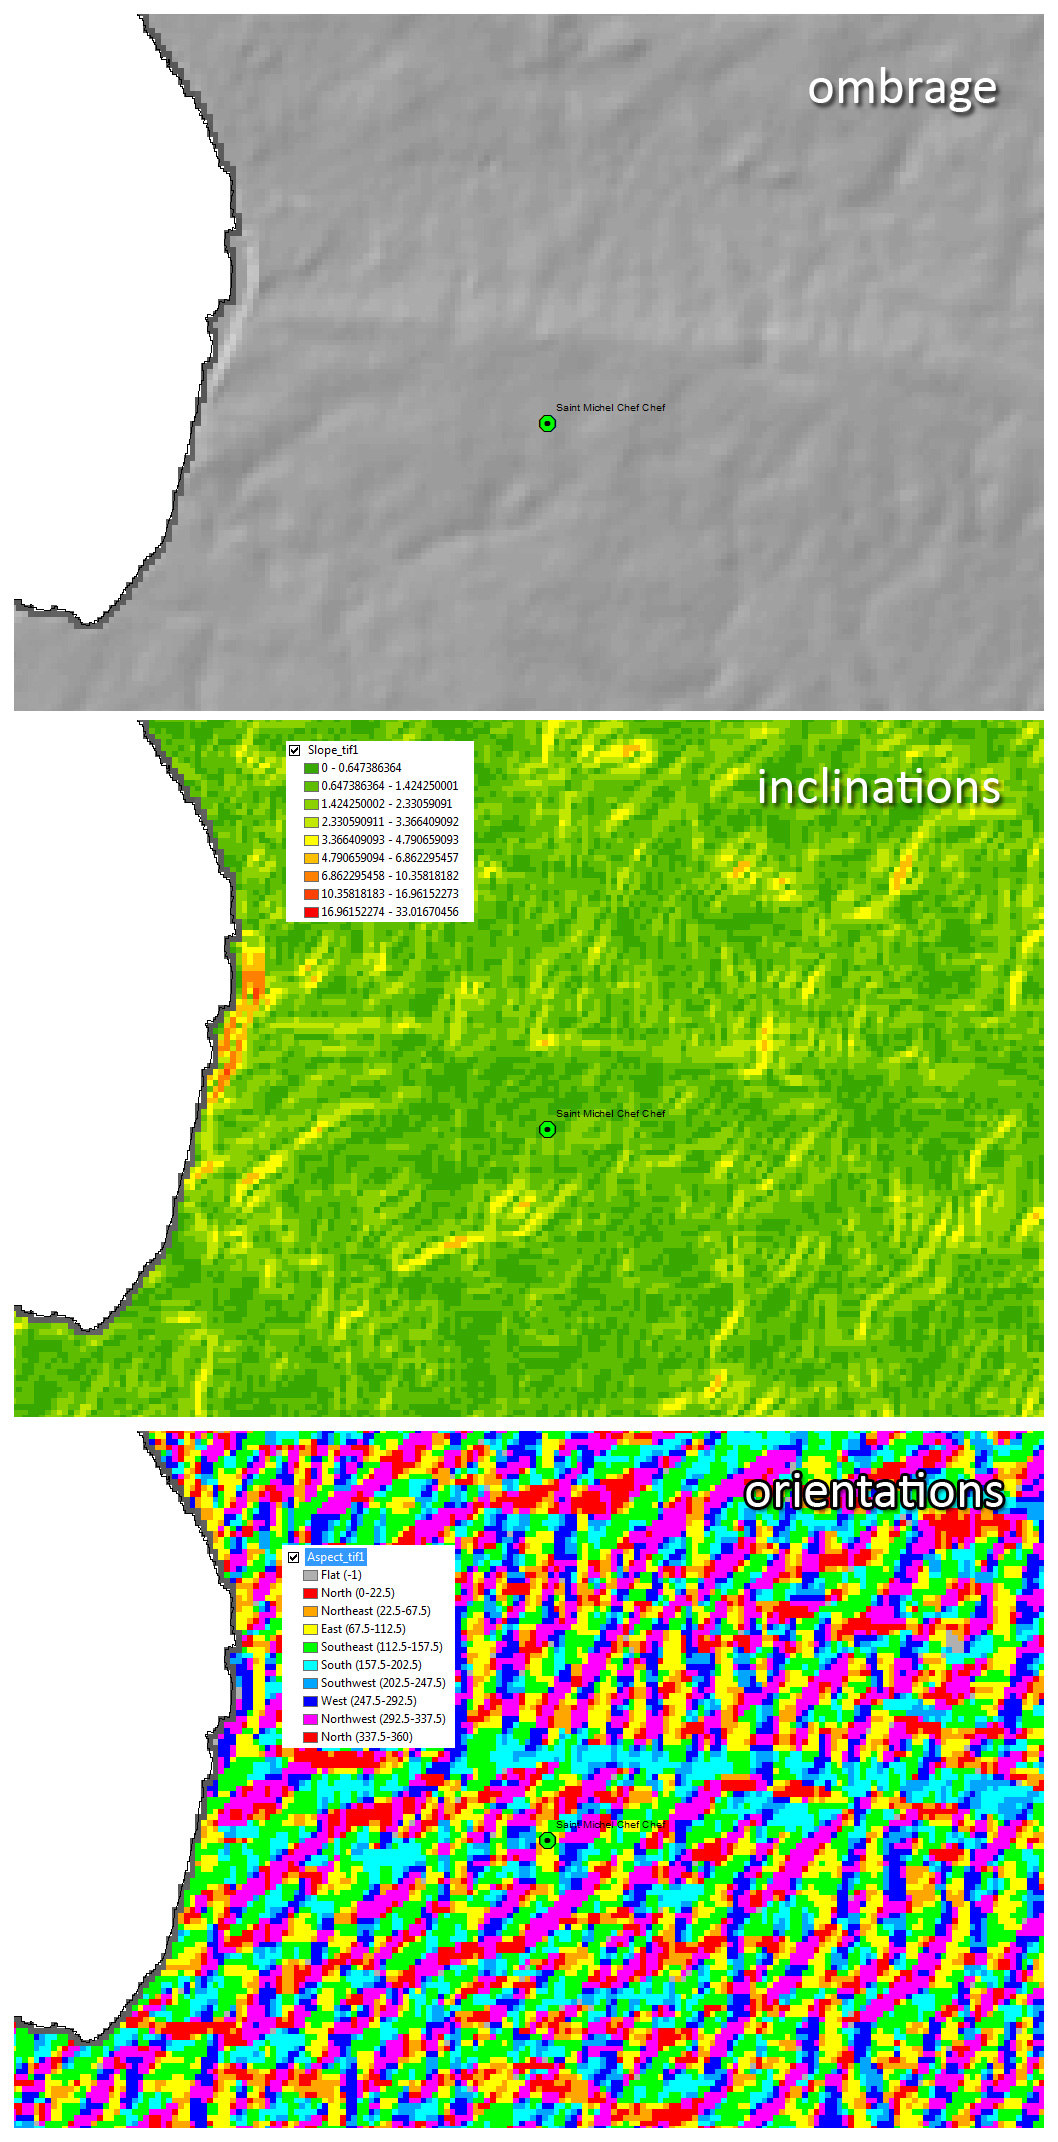
- Faire Carte d’ombrage (ArcGIS),
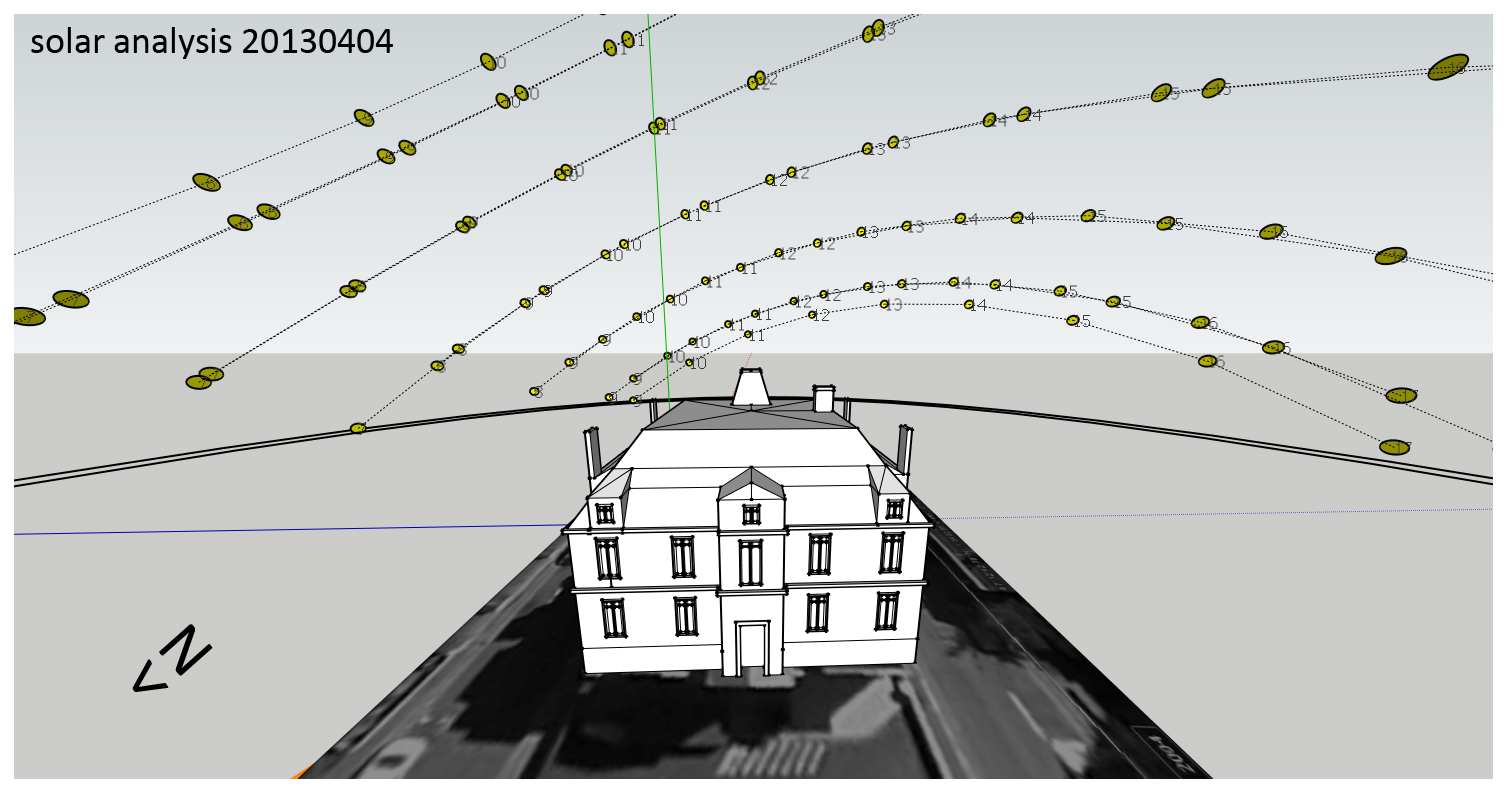
- Orientations (ArcGIS) et
- Inclinations (ArcGIS) pour mieux comprendre l’emplacement des moulins
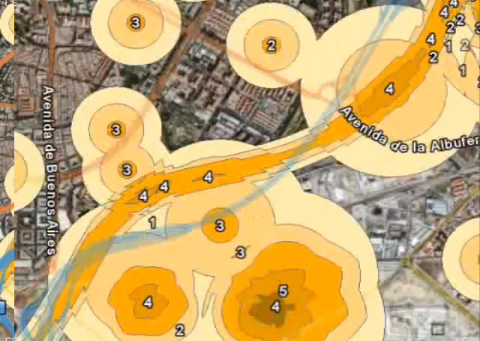
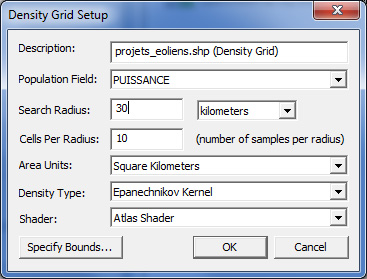
- Faire Carte de densité (en mesurent la puissance du parc)
Et maintenant la carte de densité en Global Mapper…
Name=Chauvé
Feature Type=Unknown Point Feature
Geometry=Point location: 321341.949 6688237.734 (Lat/Lon: 47° 11′ 11.0775″ N, 2° 00′ 13.7962″ W)
Map Name=projets_eoliens.shp
NOM_PARC=Chauvé
ETAT_AVANC=Permis de construire accepté
NBR_EOL=6
PUISSANCE=12
Et après, avec tous les cartes et toutes les données, faire l’interprétation, voici toutes les moulins du vent en Loire Atlantique, on peut apprécier la concentration au Nord/Nord-Est de la région:
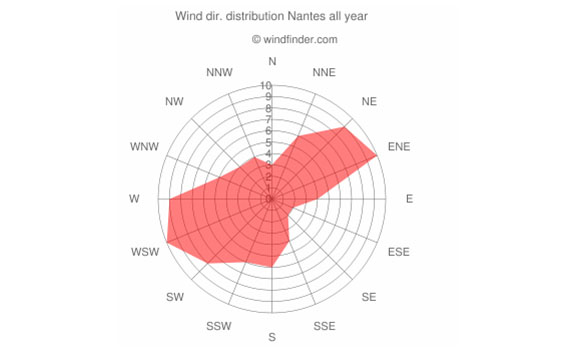
Et aussi la rose des vents (http://www.nantes-erdre.fr/statistiques-du-vent-a-nantes):
La rose des vents représentative du secteur d’étude est celle fournie par la station de Nantes-Bouguenais.
Les données ont été recueillies sur une période de 29 années (entre le 1er janvier 1971 et le 31 décembre 2000).
La rose des vents ci-après représente la distribution annuelle des vents (tous mois et toutes heures
confondues).
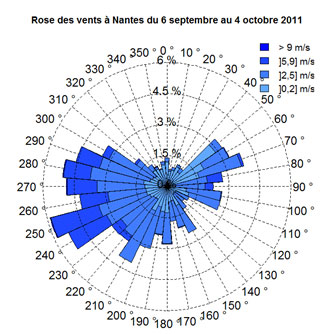
Les vents sont classés selon trois catégories :
– vents dont la vitesse est comprise entre 5 et 16 km/h (bleu),
– vents dont la vitesse est comprise entre 16 et 29 km/h (vert),
– vents dont la vitesse est supérieure à 29 km/h (orange).
Ces catégories sont ensuite reportées en terme de fréquence pour chacune des 18 directions de la rose des vents située au centre (nord, sud, est, ouest, etc.)
Les vents dominants sont les suivants :
– Les vents de secteur ouest/sud-ouest et sud (directions de 180 à 280°) qui représentent 36,5% des vents, toutes vitesses confondues. Les vents les plus forts de la station (vitesse supérieure à 29 km/h) soufflent majoritairement dans ces secteurs.
– Les vents de secteur nord-est (24,7% des vents) avec une majorité de vents faibles ou moyens (directions de 20 à 80°).

Idéalement il faut exporté raster->vector et faire l’analyses spatiale mais ça va être un outre post !
Ici, quelques liens et information général:
L’energie eolique. http://www.loire-atlantique.fr/jcms/cg1_244375/l-eolien
Documentation: http://data.paysdelaloire.fr/donnees/detail/localisation-des-projets-eoliens/?tx_icsoddatastore_pi1[page]=4&visualization=3
Éolien terrestre ou off-shore, ce mode de production électrique devrait connaître une accélération sans précédent en Loire-Atlantique d’ici à 2020.
L’éolien apparaît comme la principale source d’énergie renouvelable électrique permettant d’atteindre dans les toutes prochaines années un niveau important de production.
C’est pourquoi Le Département a fixé en juin 2010 un objectif ambitieux de puissance éolienne installée à l’horizon 2020 :
- 600 mégawatts (MW) terrestres
- 500 MW en mer.