De nuevo no voy a hacer muchos comentarios porque las imágenes hablan por sí mismas, simplemente muestro para ver con un poco de perspectiva en el futuro. En resumen, las Tasa sube sin parar, no parece que la variante Omicrón sea grave pero sí lo suficiente como para todavía provocar algunas muertes, en todo casoContinue reading “Tracking COVID19 TIA 14d a 20220111”
Tag Archives: geovisualization
Subida increíble COVID-19 tasa de incidencia 14d Navidad 2021-Año nuevo 2022!!!

Cifras realmente alarmantes no porque estén generando un aumento de presión hospitalaria (menos mal!) sino porque son las cifras de contagios más altas desde el comienzo de la pandemia, hace unos 20 meses. Incluso un servidor se ha contagiado y escribe estas líneas desde el ostracismo de un aislamiento dolorosísimo en las peores fechas del año. Esta gráfica muestra cómo se llegan a multiplicar por treinta las incidencias en dos meses…
Relación entre Tasa de Incidencia y Dinero en Madrid a 20210720 (COVID19)
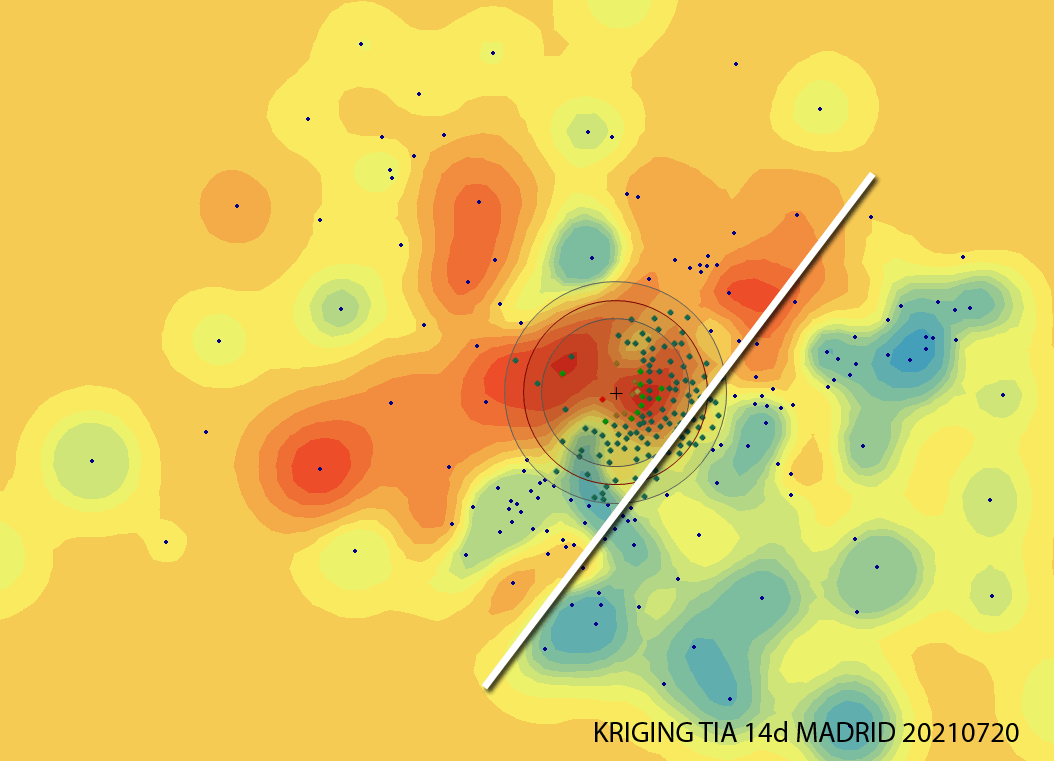
Analizando la incidencia en Madrid, a día de hoy (20210721) estas Zonas Básicas de Salud están entre las 20 más altas y preocupantes, por encima de los 780 casos por cada 100,000 en los últimos 14 días. Alguien intuye algún tipo de correlación?, Yo, sí.
500 entrenos, checked!

Hoy es un día importante para mí, desde que comencé a correr el 14 de agosto de 2014 he llegado hoy hasta los 5,500km (más exactamente 5,499km) o lo que es lo mismo, antes de fin de año, si no hay más sorpresas (ya han sido suficientes este año) estaré llegando a Teherán, la capital de Irán.
Running in Madrid. A GIS approach!

these density maps performed in Global Mapper overlay the geometry lines saved out my running application (Garmin Connect). and once they are exported to points, i can generate a density map, chosing an easy to understand legend and i overlay to Google Earth so its also easy to be sent if needed be (why for? i don’t know!).
BGS Geology of Britain: Geovisualization 100%

Oh! a must see: BGS Geology of Britain. Source from http://www.bgs.ac.uk/discoveringGeology/geologyOfBritain/home.html Britain is fortunate in possessing a remarkably varied geology within a relatively small area. The rocks that make up our islands represent a long and complicated history of events. They encompass most of the major periods of geological time and extremes of climate from desert toContinue reading “BGS Geology of Britain: Geovisualization 100%”
Visualizar mapas animados en el tiempo: Seguimiento de aves en CARTO [ENG]
SuperinteresantE demo para ‘jugar’con datos reales georeferenciados desde la aplicación CARTO. Tres aves migrando desde El Norte de Europa hasta el África subsahariana. Source: https://carto.com/learn/guides/styling/animating-maps-with-point-data This guide describes how to visualize point data over time, by applying the ANIMATED aggregation style to animate your map. This feature requires a map layer containing point geometries withContinue reading “Visualizar mapas animados en el tiempo: Seguimiento de aves en CARTO [ENG]”
Visualizing Tweets!
How about a quick visualization of tweets in CartoDB? Hey guys, the way we used to visualize is changing on a daily basis so it’s time to catch up!!!. Let’s add a timestamp and play!! We will take a look at this dataset in depth shortly so be aware of our schedule! Regards, Alberto C.MScContinue reading “Visualizing Tweets!”
Creating value through Open Data

The benefits of Open Data are diverse and range from improved efficiency of public administrations, economic growth in the private sector to wider social welfare (Source: http://www.europeandataportal.eu/) Performance can be enhanced by Open Data and contribute to improving the efficiency of public services. Greater efficiency in processes and delivery of public services can be achieved thanks toContinue reading “Creating value through Open Data”
Cheers! Geovisualization.net has just been released!
Helo everybody. Geovisualization.net has just been released. Hope you like it.
