Esta vez me tocó impartir el seminario motivacional “Geógrafos en tiempos de GIS” en el entorno del Máster de Tecnologías de la Información Geográfica. Yo encantado pues este mismo máster lo cursó yo hace ya doce años (wow, time flies, el tiempo pasa rápidamente cómo dicen!) y la verdad es que me encantó hacerlo.
Author Archives: Alberto
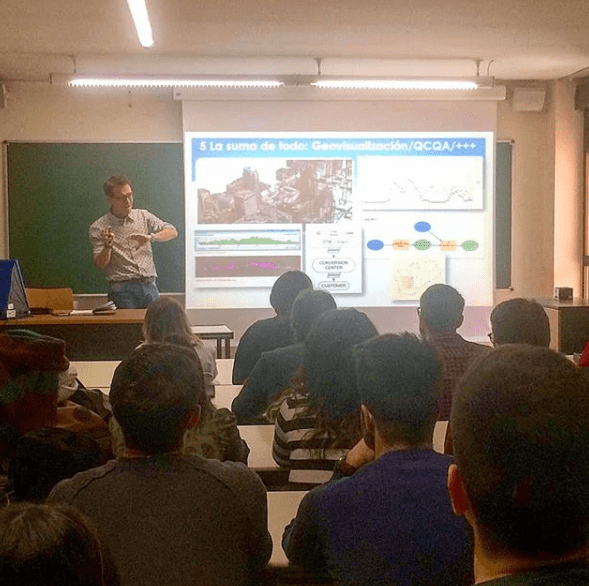
Seminarios motivacionales para (quizá) futuros Geógrafos

La idea era mostrar el día a día del trabajo de un Geógrafo cualquiera (yo) y el recorrido que me ha llevado hasta aquí. El porqué de la elección de la carrera, los diferentes trabajos, las influencias de otros trabajos a priori sin conexión, el día a día actual, etc.
+53,000 visits from 166 countries!!

This is just for leting you guys know i have received visits from almost all over the world
Análisis de la inundación en Sant Llorenç des Cadassar (Baleares, España) en Octubre 2018

Esta simulación con datos reales permite constatar empíricamente la pésima ubicación del pueblo en medio del cauce de un torrente al mismo tiempo que muestra lo osado de no gastar el dinero suficiente en infrastructuras que salven la vida de los habitantes de un entorno potencialmente peligroso en situaciones de borrascas ocluídas (gotas frías) o ciclogénesis expansivas, tan comunes en esta epoca del año por esta zona.
El láser desvela toda la grandeza de la civilización maya (Fuente: El País)
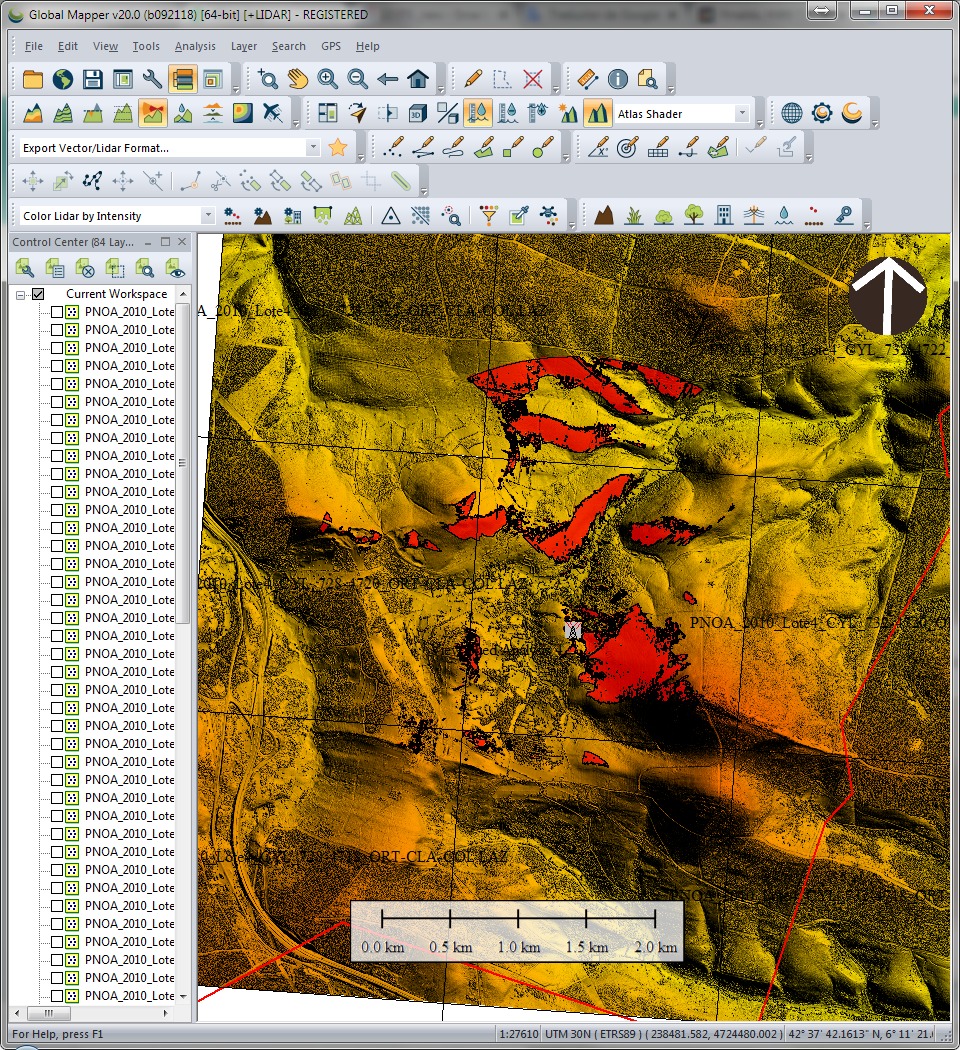
Esta mañana encontré este interesante reportaje sobre el LIDAR (Laser Imaging Detection and Ranging, detección y localización de imágenes por láser) la tecnología con la que trabajo desde hace años y que a algunos les parece recién inventada, jeje.
Retirada de vehículos por la grúa municipal en Madrid: Una aproximación visual usando Datos Abiertos.

Solo estoy tomando en cuenta 185 puntos debido a las limitaciones de mi servidor de geocode https://www.mapdevelopers.com/batch_geocode_tool.php pero muestra que los datos tienen sentido, siendo el barrio de Sol el que concentra una densidad mayor de actuaciones de la grua municipal. Para el fondo, he usado una conexón WMS a OSM y geometrías de Barrios tomadasContinue reading “Retirada de vehículos por la grúa municipal en Madrid: Una aproximación visual usando Datos Abiertos.”
La simbolización, las leyendas de los mapas y la prensa española

Un periodista, un diseñador, un influencer… muy guay pero para hacer los mapas, preguntad a un Geógrafo. Cada vez es más fácil usar servicios web con cartografía precargada tipo CARTO o MAPBOX pero esto no es suficiente si lo que queremos es comunicar un fenómeno o un dato de manera correcta.
Telco Data Monetization using CARTO
As per this interesting presentation from CARTO’s side: Accelerate your data monetization revenues and provide Location Intelligence by applying spatial analytics to your mobile network event data with CARTO. Impress your clients across all sectors in pre-sale and post-sale by delivering visualizations which bring to life the business insights created by telecommunications data.
Espacios Creativos de Trabajo
Representación de ubicaciones de Espacios Creativos de Trabajo en Madrid, España Despliegue de ECT. Madrid, España
Running in Madrid. A GIS approach!

these density maps performed in Global Mapper overlay the geometry lines saved out my running application (Garmin Connect). and once they are exported to points, i can generate a density map, chosing an easy to understand legend and i overlay to Google Earth so its also easy to be sent if needed be (why for? i don’t know!).
