
Dont get wrong if you see the IA background showing our handsome major showing his beautiful smile in Cibeles/Correos, it’s only to get your precious attention (only if you need it thou!). Flooding in urban environments is not a speculative hazard but something we can quantify. In the case of Madrid, the intersection of pretty mountainous terrain and urban expansion presents a scenario of significant risk, particularly when analyzed through the lens of shared high-resolution geospatial data (it might surprise you there are 2000m difference between the highest spot in Madrid province, Pico Peñalara -2428m- and the Alberche river environment in some areas -430m-).
This study integrates the buildings from BTN (Base Topográfica Nacional) provided by the Spanish “IGN”, the CNIG with the official flood hazard maps for a 100-year return period (T=100), published by the Ministry for the Ecological Transition and the Demographic Challenge (MITECO). The T=100 scenario is the most representative for evaluating long-term flood exposure, as it reflects events with a 1% annual probability—rare but not improbable, and certainly not negligible.
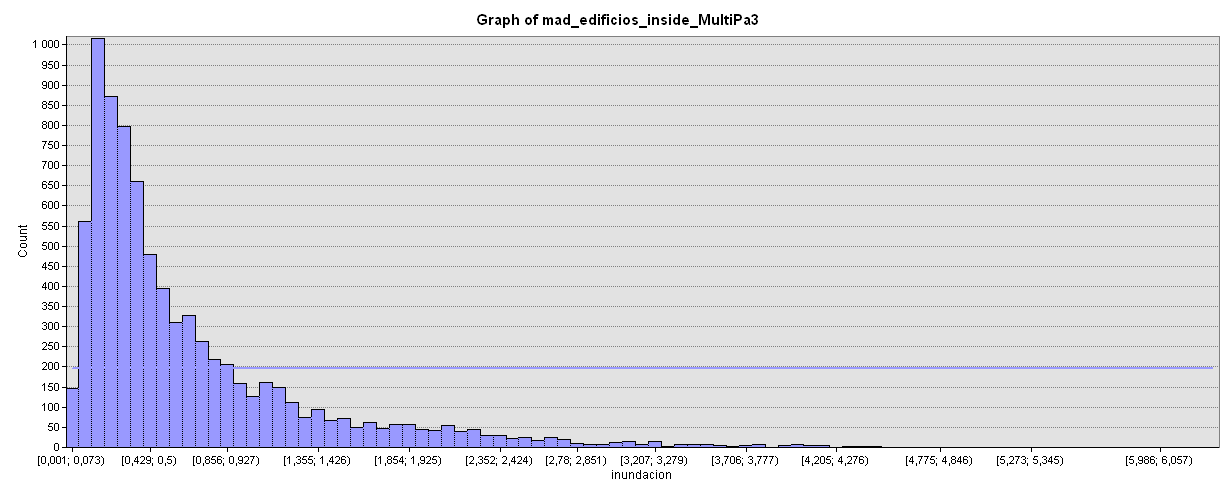
If we measure preliminarily, only 0.999% (8097/810134) of all buildings (available in our latest BTN buildings provided by CNIG) would be affected but but if we go deeper, this means a lot in specific spots: Aranjuez for instance would be very affected by the Tajo river flood.

The spatial overlay of flood-prone zones with demographic and land-use data reveals a concerning concentration of residential population within areas designated as ARPSIs (Áreas de Riesgo Potencial Significativo de Inundación). These zones include dense urban districts along the Manzanares River and low-lying areas in Arganzuela, Usera, and parts of Puente de Vallecas.
While precise population figures vary depending on the granularity of census data, preliminary estimates suggest that tens of thousands of residents could be directly affected by a flood event of this magnitude. The implications extend beyond displacement and property damage, encompassing public health risks, disruption of essential services, and long-term socioeconomic instability.

Economic activities within these flood zones are diverse and structurally significant. Central districts host a high concentration of retail, hospitality, and cultural institutions, while peripheral zones near the M-30 corridor accommodate logistics, warehousing, and industrial operations. The exposure of these sectors to flood risk implies not only direct financial losses but also cascading effects on employment, supply chains, and urban mobility. Moreover, the presence of public infrastructure—transport nodes, administrative buildings, and emergency services—within these vulnerable areas raises questions about the resilience of the city’s operational backbone.
*Retail and hospitality in central districts (e.g., Lavapiés, La Latina)
*Logistics and warehousing near the M-30 corridor
*Cultural and tourism assets, including museums and heritage sites
*Public infrastructure, such as metro stations, bus depots, and administrative buildings
Disruption in these zones could result in multi-million euro losses, not only from direct damage but also from prolonged service interruptions.
I have uploaded a small sample over Aranjuez to my GEE interface (is not that I am from this place, I only find it representative!). You can quickly tune the JavaScript code to be able to count the amount of buildings affected, the area of all of them and the DTM range of the flood DTM REM (Relative Elevation Model) over your actual screen.
https://code.earthengine.google.com/1d7e907283e33dc4b468ab3adf578840

Of particular concern is the identification of facilities regulated under Annex I of Directive 96/61/EC, which governs integrated pollution prevention and control.

*Fuel storage and distribution centers
*Waste treatment plants
*Industrial facilities with hazardous materials
These include fuel depots, waste treatment centers, and industrial sites handling hazardous substances. In the event of flooding, such facilities pose a risk of accidental contamination, with potential impacts on protected zones defined in Annex IV of Directive 2000/60/EC. These zones include drinking water abstraction points, Natura 2000 habitats, and recreational waters. The spatial proximity of these sensitive areas to flood-prone industrial sites underscores the need for integrated risk assessment that goes beyond hydrological modeling and incorporates environmental and public health dimensions.
(i) Drinking water abstraction points
(iii) Habitats designated under Natura 2000
(v) Recreational waters and sensitive ecosystems
The visual simulations accompanying this analysis are intentionally exaggerated. They do not represent predictive models but serve as heuristic devices to provoke reflection and debate. By depicting iconic Madrid landmarks submerged under chaotic floodwaters, these images challenge the viewer to confront the consequences of urban planning decisions that disregard hydrological constraints. They are not intended to alarm, but to illustrate the scale of disruption that could result from a statistically plausible event.
Please note these features have been taken out of the scope of this preliminary approach for analysis Flood in Madrid province using Open Data.
Again, this study/first approach would not have been possible without access to open geospatial data. The availability of national datasets such as the Base Topográfica Nacional and flood hazard maps from MITECO exemplifies the transformative potential of public data infrastructures. However, the mere existence of data is insufficient. What is required is a culture of proactive use—by planners, policymakers, and civil society—where risk is treated not as an abstract probability but as a concrete design constraint.
The presence of vulnerable populations, critical infrastructure, and environmentally sensitive facilities within flood-prone zones constitutes a non-assumable risk. It is a risk that could be mitigated through better zoning, stricter regulation, and investment in adaptive infrastructure. The cost of inaction is not only economic but ethical. Avoidable losses—whether of property, livelihoods, or ecosystems—are a failure of foresight, not fate.
For full maps, methodology, and downloadable layers, visit geovisualization.net.. Flood Risk Maps T=100 (MITECO): https://www.miteco.gob.es/es/cartografia-y-sig/ide/descargas/agua/riesgo-inundacion-fluvial-t100.html
Sources:
https://centrodedescargas.cnig.es/CentroDescargas/listaFicheros
https://www.miteco.gob.es/es/agua/temas/gestion-de-los-riesgos-de-inundacion/snczi.html
Software used: ArcGIS Pro 3.6 + Global Mapper 26.2 + Photoshop X + Copilot (IA cover) (+GEE)
