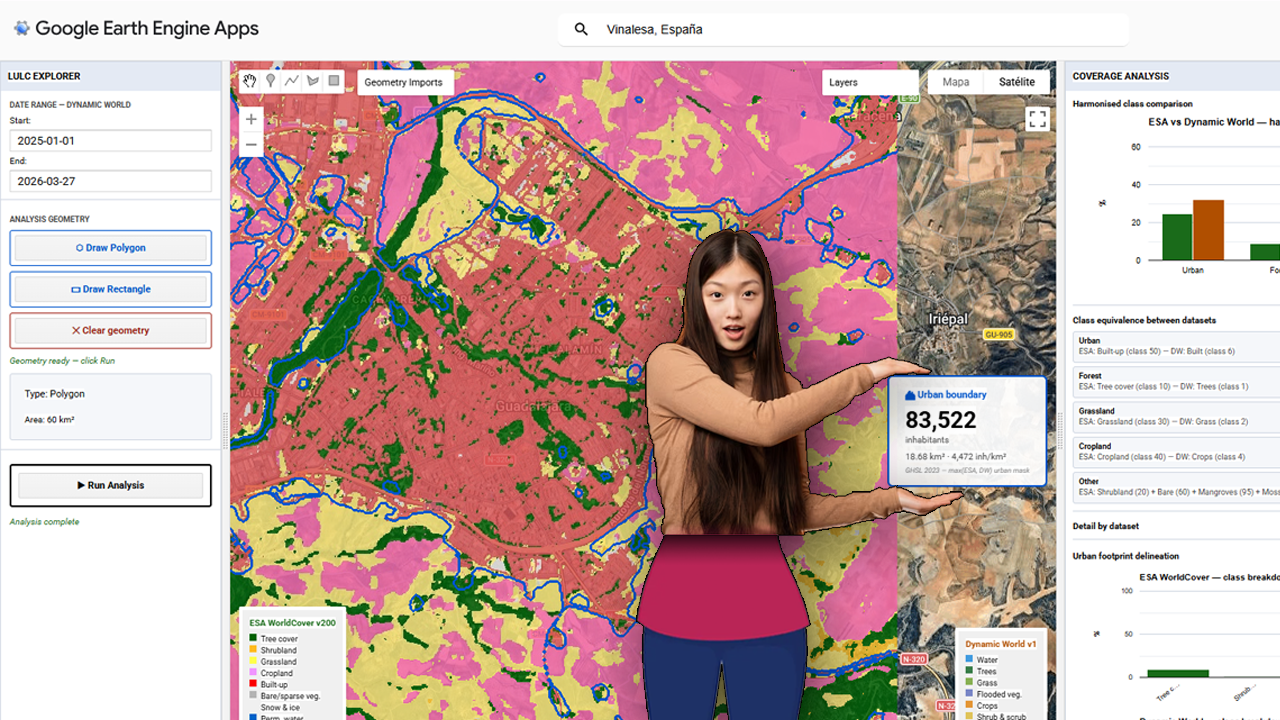
The foundational step of this methodology involves the deployment of a centralized processing interface within the Google Earth Engine (GEE) environment. The provided visualization captures the core interface of the custom GEE application, which serves as the hub for the multi-sensor LULC validation pipeline. Within this dashboard, users can define a specific Area of Interest (AOI)—highlighted here over the Iberian Peninsula and North Africa—and configure key parameters, including temporal ranges for the acquisition of sentinel-derived products. Crucially, the interface is designed to load and compare two primary datasets simultaneously: Dynamic World (near real-time, probability-based LULC) and ESA WorldCover (10m resolution structured LULC). The contrasting classification schemes are represented by the legends on the left and right sides of the map view, which illustrate the varying definitions of ‘Built-up’ and urban areas between the two products. Establishing this visual and statistical comparison at the application level is the prerequisite for calculating the spatial disagreement threshold, or delta, that guides the subsequent merging and population estimation phases.
Tag Archives: utilities
Smarter Streets: Case Studies for Cities and Utilities – Learn How the City of Baltimore and Washington Gas Reduced Costs
In the City of Baltimore, the decades-old infrastructure consists of 2,000 miles of roads, 300 bridges and culverts, 7,600 miles of water pipes, storm water drains and wastewater lines, and 3.7 million feet of conduit. Washington Gas serves more than one million residential, commercial and industrial customers throughout the Washington, DC metropolitan area. What theyContinue reading “Smarter Streets: Case Studies for Cities and Utilities – Learn How the City of Baltimore and Washington Gas Reduced Costs”
