
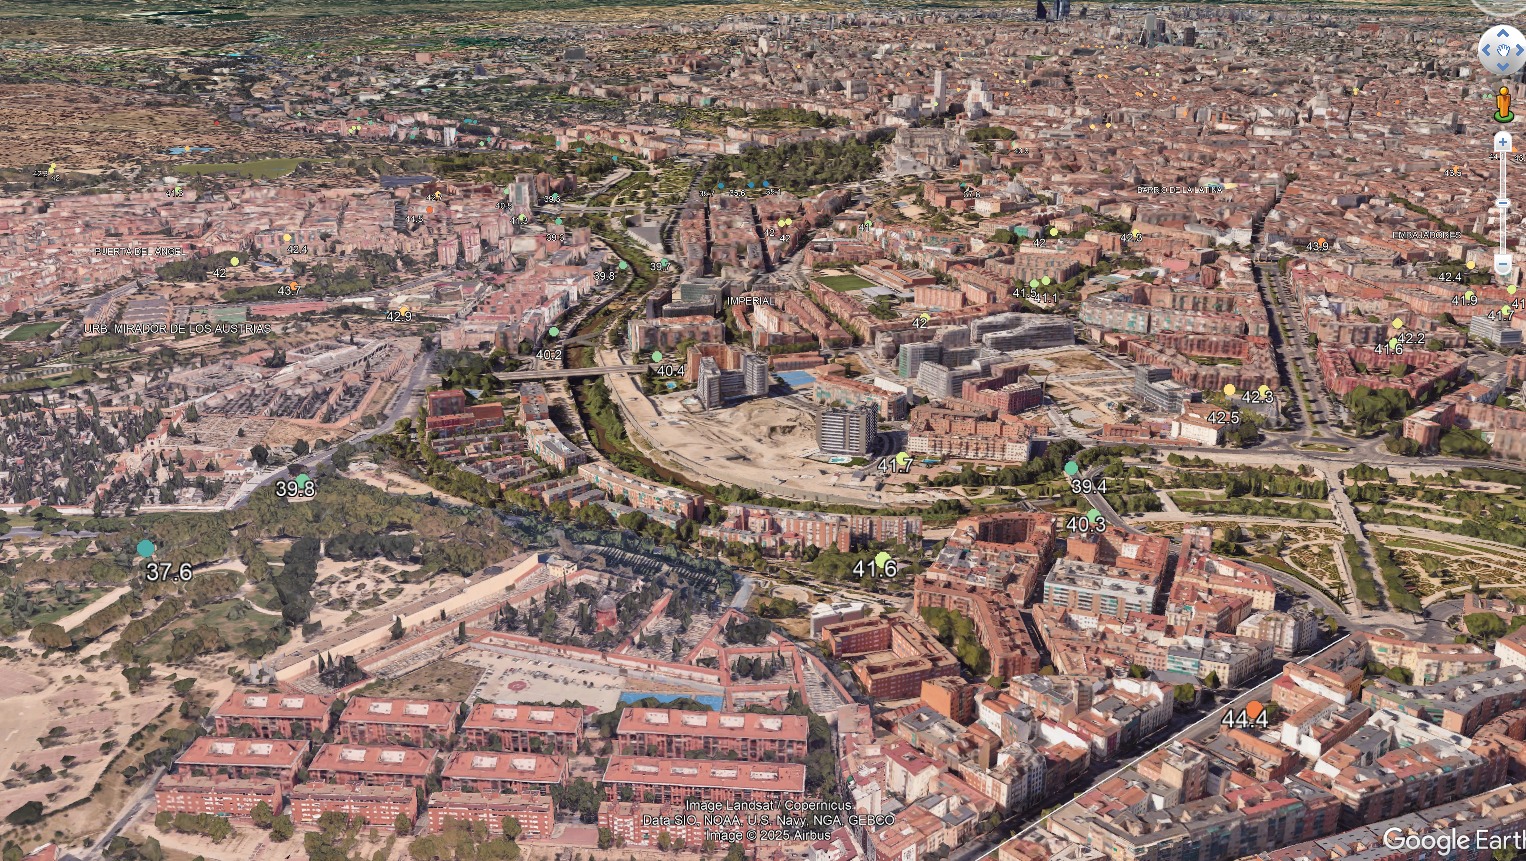
Between June 21 and September 21, 2024, I analyzed the surface temperatures of all 2,123 registered playgrounds in Madrid using Landsat 8/9 imagery (Level-2 Surface Temperature products). This investigation, an extension of my previous reflection on urban heat and environmental justice in Geovisualization.net (May 2025), highlights how thermal exposure is patterned by geography, planning legacies, and demographic vulnerability in the Spanish capital.

Out of Madrid’s 131 officially recognized neighborhoods, four—Argüelles, Recoletos, Ibiza, and Sol—had no public playgrounds at all. While these central areas are often associated with wealth and touristic activity, their lack of dedicated children’s public spaces points to a subtler form of spatial exclusion: not through excess heat, but through the absence of accessible, age-inclusive infrastructure.

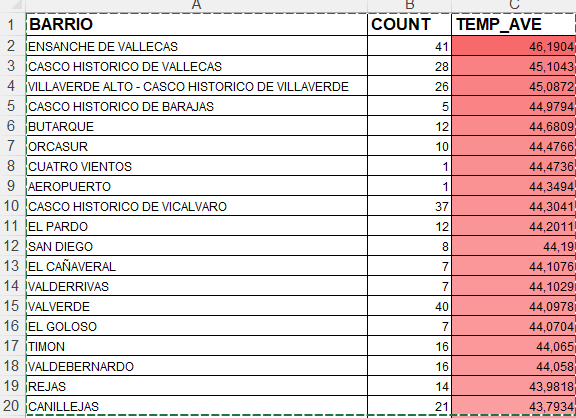
In contrast, peripheral neighborhoods such as Ensanche de Vallecas and Villaverde not only host a large number of playgrounds (41 and 26 respectively), but also recorded some of the highest mean surface temperatures in our entire dataset—exceeding 45 °C in many cases, with peaks around 46.2 °C.
| Neighborhood | Avg Temp (°C) | # Playgrounds |
|---|---|---|
| Ensanche de Vallecas | 46.19 | 41 |
| Casco Histórico de Vallecas | 45.10 | 28 |
| Villaverde Alto | 45.09 | 26 |
| Casco Histórico de Barajas | 44.98 | 5 |
| Butarque | 44.68 | 12 |
What emerges clearly is a strong south-to-north thermal gradient. Neighborhoods located in the southern and southeastern sectors of the city systematically registered higher average temperatures across their playgrounds. These areas tend to combine dense building fabrics, limited canopy coverage, sparse urban forest infrastructure, and higher concentrations of impermeable surfaces such as asphalt and concrete. Unsurprisingly, they also overlap with the most socioeconomically disadvantaged parts of Madrid. Many of the hottest zones—including Casco Histórico de Vallecas, Butarque, Orcasur, and Villaverde Alto—align with broader patterns of structural neglect, where historical underinvestment in green infrastructure amplifies the risks of climate exposure.

You can find all 2123 playground parks and their average temperature accordingly here: https://www.dropbox.com/scl/fi/arwu0ekueo9r6vz8gm005/areas_infantiles202506_temp_OK.kmz?rlkey=2vmik3mx40e42uwgmudmnbmkv&dl=0
This heat disparity becomes even more urgent when considered alongside demographic data. According to recent figures (2024), districts like Villa de Vallecas, Vicálvaro, Barajas, and Fuencarral–El Pardo have the highest proportions of residents under 15 years of age. The convergence between these child-dense districts and high surface temperature values is particularly striking in Ensanche de Vallecas and Casco Histórico de Vallecas, where children are not only more numerous, but also more thermally exposed during the peak summer months. It is in these areas—where vulnerability accumulates across age, income, and environment—that thermal injustice becomes most acute.

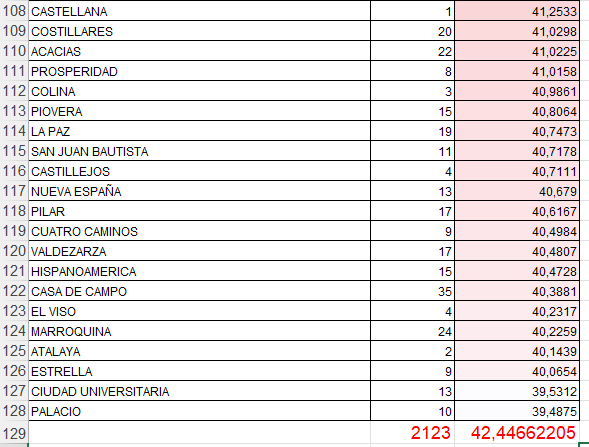
In the opposite side, playgrounds in the northern and northwestern parts of the city consistently recorded significantly lower surface temperatures. Areas such as Ciudad Universitaria (39.5 °C), El Viso (40.2 °C), Nueva España (40.6 °C), and Valdemarín (41.7 °C) benefit from a combination of urban tree cover, proximity to institutional campuses or forested parkland, and lower built density. The result is a materially cooler outdoor environment for children. In these districts, playgrounds function as thermally moderated, socially accessible urban commons—something far from guaranteed in their southern counterparts.
The spatial and thermal patterns uncovered in this analysis underscore that playgrounds are not thermally neutral spaces. Instead, they mirror—and in many cases, magnify—the uneven geographies of climate resilience in Madrid. In the southern periphery, children are more likely to play in unshaded, heat-intensified environments that fail to provide basic thermal comfort during extreme summer conditions. In the north, cooler playgrounds are often embedded in greener, better-resourced neighborhoods where environmental quality is not an exception but an urban standard.

From a policy perspective, these findings call for targeted interventions. Thermal adaptation must prioritize those neighborhoods where elevated temperatures and high child populations intersect. This means retrofitting playgrounds in places like Ensanche de Vallecas, Villaverde, and Puente de Vallecas with shading structures, permeable surfaces, and strategically planted vegetation. At the same time, the absence of playgrounds in central neighborhoods like Argüelles or Recoletos should not be overlooked. Reclaiming even small parcels of urban space for child-friendly, thermally conscious design could contribute meaningfully to both social and microclimatic equity.
Madrid’s playgrounds are not only sites of recreation—they are thermometers of environmental justice. In a warming climate, who plays where, and at what temperature, is a question that speaks directly to the ethics of urban planning.
This is the excel file with all barrios, all playground counts by barrio and all average temperatures by playground taking into account all available Landsat 9 images during that 90 days period (roughly ten images with cloud coverage less than 5%).
https://www.dropbox.com/scl/fi/ffs997vq96nbxcqf59gqy/final.xls?rlkey=nfdi680eow4v63ar6on8jendl&dl=0
Hope you guys enjoy the post, if so, let me know. Your feedback is greatly appreciated.
Alberto C.
Senior Data Analyst and worried about inequity
https://datos.gob.es/es/catalogo/l01280796-barrios-municipales-de-madrid
https://datos.madrid.es/portal/site/egob/menuitem.c05c1f754a33a9fbe4b2e4b284f1a5a0/?vgnextoid=102454b0951ac510VgnVCM2000001f4a900aRCRD&vgnextchannel=374512b9ace9f310VgnVCM100000171f5a0aRCRD&vgnextfmt=default
https://elpais.com/espana/madrid/2025-06-10/que-calor-hace-en-cada-parque-infantil-de-madrid-los-satelites-de-la-nasa-dicen-que-el-64-se-disparan-hasta-los-41-grados-o-mas.html
https://x.com/MasMadrid__/status/1932336253174718501
https://x.com/CiudadanO_O/status/1932310753958117504
https://code.earthengine.google.com/edf2c111f8f5bbcfc578a41224421d9f
